
Creating a report on the budget and cost of risks in MS Project Pro
Contents:
- Adding the filter by "Cost type" field
- Creating a report on the budget and cost of risks in MS Project Pro
- Chat
Adding the filter by "Cost type" field
To create a report on the budget and cost of risks, you need to create a filter by the "Cost type" field.
Steps to update the "Cost type" field:
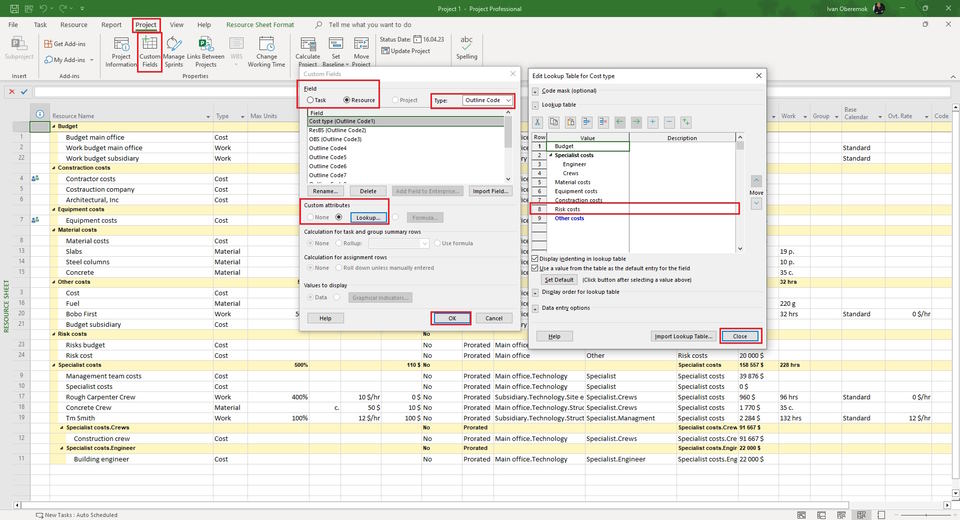
- Click the "Project" button in the top menu.
- Click the "Custom Fields" button in the "Properties" block.
- Click the "Resource" box.
- Select the "Outline Code" in the "Type" field.
- Select an empty field and rename it by click the "Rename ..." button.
- Set the list of values by clicking the "Lookup ..." button.
- Add a new row. (For example "Risk cost")
- Click the "Ok" button.
Steps the create the "Cost type ..." filter in MS Project Pro:
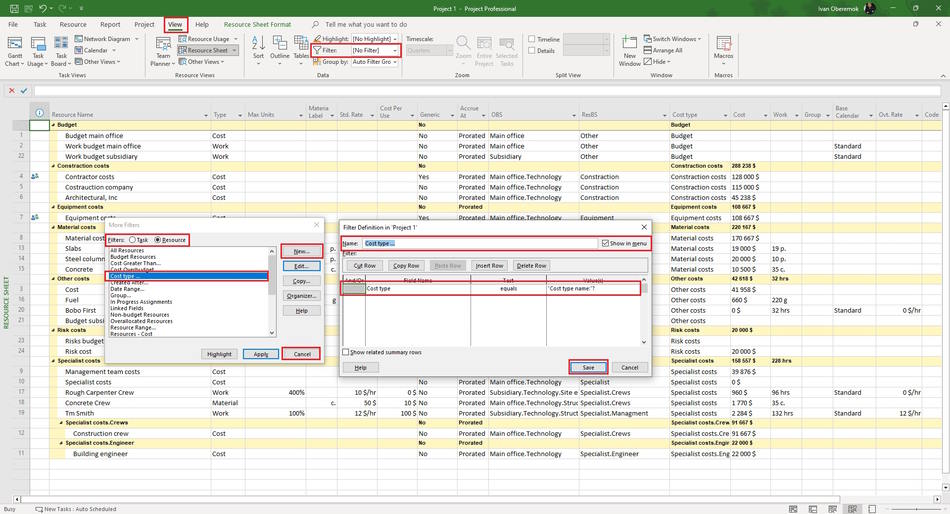
- Click "View" the item in the top menu.
- Open the "Filter" field in the "Data" block.
- Click the "More Filters ..." button.
- Click the "Resource" in the "Filters:" block.
- Clicking the "New ..." button.
- Enter the name in the "Name:" field. (For example "Cost type ...")
- Click the "Show in menu" box.
- Select the "Cost type" in the "Field Name" column.
- Set the "equals" in the "Test" field.
- Set the "Cost type name:"?" in the "Value(s)" field.
- Click the "Save" button.
- Click the "Cancel" button.
Creating a report on the budget and cost of risks in MS Project Pro
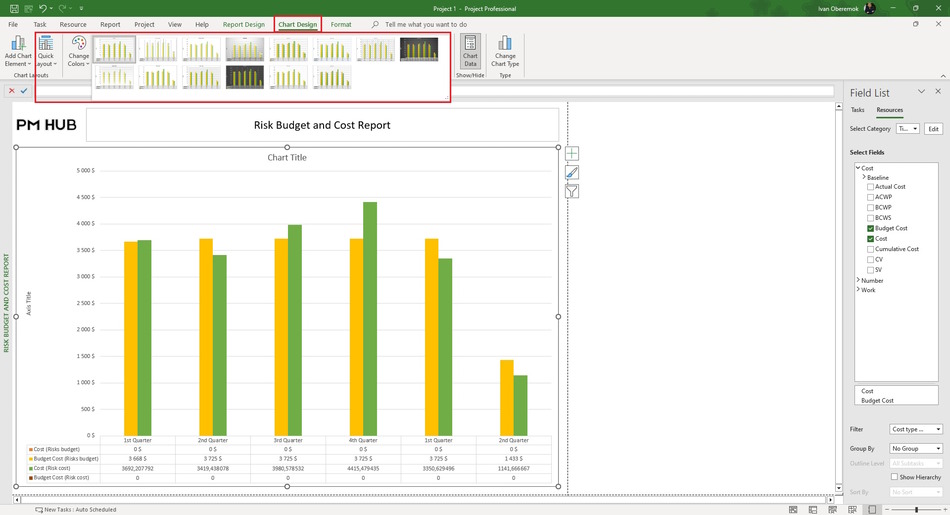
To analyze the use of the project risk budget and risk cost, you can create a report in MS Project Pro. In the report, we compare the risk budget and the risk cost of the project by period.
Steps to add a chart to a risk budget and cost report in MS Project Pro:
- Click the "Report" item in the top menu.
- Create the report.
- Click the "Report Design" item in the top menu.
- Click the "Chart" button in the "Insert" block.
- Set the report name.

Steps to customize the chart data:
- Click the "Chart Desigen" item in the top menu.
- Click the "Chart Date" button in the "Show/Hide" group.
- Select the "Resource" in the "Field List" block.
- Select the "Time" in the "Select Category" field.
- Click the "Edit" buttom. Set the time period format:
- Set the "Querters" in the "Units:" field.
- Set period start date in the "Start:" field.
- Set period end date in the "Finish:" field.
- Click the "Ok" button.
- Click on the required fields in the "Select Field" box. Select fields: "Budget Cost" and "Cost"
- Select the "Cost type ..." filter in the "Filter" field. (Read more "Adding the filter by "Cost type" field")
- Set the "No Group" in the "Group by" field.
For customize the chart in the report in MS Project Pro select the chart: (Read more "Customize the chart in the report in MS Project Pro")
Block "Chart Layouts"
- Add Chart Element - You can add chart elements: "Axes", "Axes Title", "Chart Title", "Date Label", "Date Table", "Error Bar", "Gridlines", "Legend", "Lines", "Trendline", "Up/Down Bar". The list of elements depends on the type of chart
- Quick Layout - You can use templates with set elements.
Block "Chart Style"
- Change Colors. You can choose a set of color templates click the "Change Colors" button and choose the color template.
- Select a chart style, click the "Chart Style" block.
Block "Change Chart Type"
- You can change the chart type. Click the "Change Chart Type" button and select the chart type.
#msprojectpro, #oberemokii, #projectmanagment, #projectriskmanagement, #monitoringandcontrollingprocess, #projectcommunicationsmanagement

Author: Ivan Oberemok
