
Type of tables in Project Data and what type choose for report
Contents:
Type of tables
In ProjectData all tables divided into two types: time-distributed and non-time-distributed.

All time-distributed tables have in end of name “TimephasedDataSet”, it means that all data will be tied to a specific date, not summarize to one row.

Difference between two types of tables
So, we know that one type of table distributed data in time. All other tables just give you summarize data in one row. Let see example in Power Query on project cost, how it looks like in two tables: time-distributed and non-time-distributed.

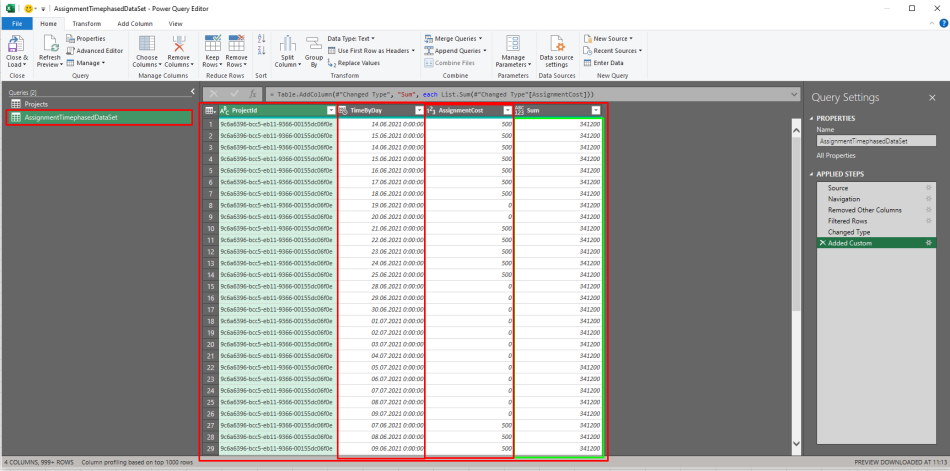
We see that information the same but in first table we get just one numeric and in second – distribution of this number to a specific date.
What type choose for report
When preparing a report based on Project Data, one of the most important decisions is choosing the correct type of table to use. This may seem like a minor technical detail, but in reality it directly affects the accuracy, performance, and clarity of your final report. Many users ask why it is not enough to simply work with a single type of table and aggregate the necessary values manually. The reason is that different reports require different levels of data granularity, and a universal one‑size‑fits‑all table would either overload the system or fail to provide the needed level of detail.
The entire idea behind selecting the appropriate table type is to ensure the creation of technically competent and efficient reports. For example, if you need a simple summary containing cost, actual cost, and remaining cost without analyzing the data over a specific time period, using time‑distributed tables becomes unnecessary. These tables contain large volumes of detailed period‑based information, and summarizing it into a single number not only adds extra work but can also slow down the refresh process of your report. If the report does not require daily, weekly, or monthly breakdowns, using highly detailed tables introduces redundant complexity.
Moreover, relying on excessively detailed datasets increases the amount of data transferred and processed by your reporting tool. As a result, the system may take noticeably longer to update, especially when your portfolio contains many projects or long‑running schedules. This impacts not only performance but also the overall experience of interacting with the report.
Therefore, before designing the final structure of your report, it is highly recommended to clearly define what type of data you need, how detailed it must be, and what business questions the report should answer. Once this is understood, you can build a proper data model using only the necessary tables. This approach prevents unnecessary overload, ensures faster report refresh times, and maintains high clarity and accuracy in the resulting visualizations.

Author: Ivan Oberemok
