
Setting the graphical indicator in MS Project Pro
Contents:
- Setting to data for the graphical indicator in MS Project Pro
- Creating the graphical indicator in MS Project Pro
- Chat
Setting to data for the graphical indicator in MS Project Pro
The graphical indicator is placed by custom field. We must create custom field and set the data in this field. We can use the formula to set the data in the field. For example, we will create the graphical indicator for the variance cost field.
Steps to create the formula for the graphical indicator in MS Project Pro:
- Click the “Project” item in the top menu.
- Click the “Custom Field” button in the “Properties” block.
- Set the “Task” in the block field.
- Select the “Cost” in the “Type:” field.
- Select the empty row of the list of the field.
- Rename the field:
- Click the “Rename …” button.
- Entered the “GI Variance” in the field “New name for Cost1”.
- Click “Ok” button.
- Add the formula:
- Click the “Formula …” button.
- Click the “Field” button in the “Formula for “GI Variance” window.
- Select the “Cost Variance”.
- Click the “Ok” button.
- Set the calculation for task and summary group by click the “Use formula” box.
- Click the “Ok” button.
- Add your custom field.
Check the calculation data.

Creating the graphical indicator in MS Project Pro
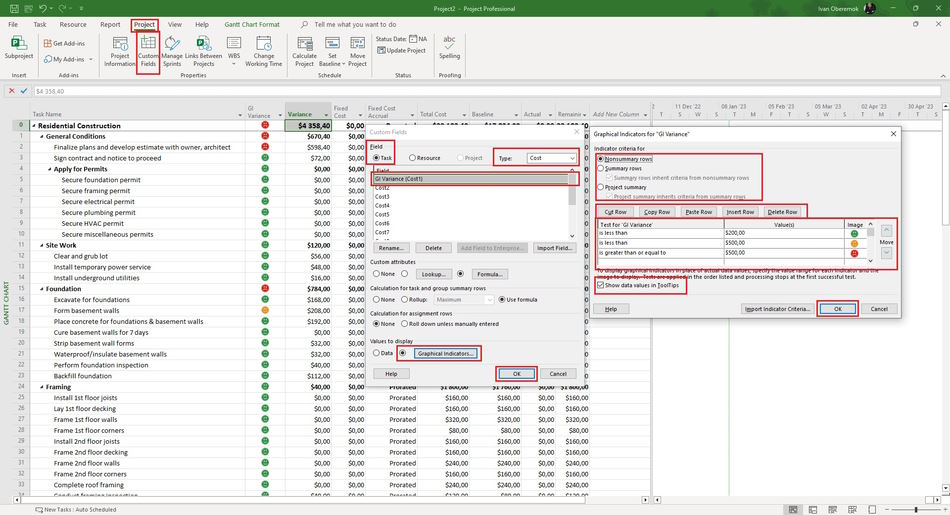
Steps to create the formula for the graphical indicator in MS Project Pro:
- Click the “Project” item in the top menu.
- Click the “Custom Field” button in the “Properties” block.
- Set the “Task” in the block field.
- Select the “Cost” in the “Type:” field.
- Click the "Graphical indecators ..." button.
- Select the rule in the "Test for "GI Variance" column. Rules are checked from top to bottom
- Set the rule value in the "Value(s)" column.
- Set the image in the "Image" column.
- You can cut the rule:
- Select the row.
- Click the "Cut Row" button.
- You can copy the rule:
- Select the row.
- Click the "Copy Row" button.
- You can paste the rule:
- Stand the previous row.
- Click the "Paste Row" button.
- You can inset the empty rule:
- Stand the previous row.
- Click the "Insert Row" button.
- You can delete the rule:
- Select the row.
- Click the "Delete Row" button.
- If you want to show costume field value, click the "Show data values in ToolTips" box.
- You can set the other rules for the summary rows:
- Click the "Summary rows" box.
- You can use nonsummary rules, click the "Summary rows inherit criteria from nonsummary rows" box.
- Or you can set unique rules.
- You can set the other rules for the project summary rows:
- Click the "Project summary" box.
- You can use nonsummary rules, click the "Project summary rows inherit criteria from summary rows" box.
- Or you can set unique rules.
- Click the “Ok” button in the "Graphical Indicators for "GI Variance" window.
- Click the “Ok” button
#msprojectpro, #oberemokii, #projectmanagment, #projectintegrationmanagement, #executingprocess

Author: Ivan Oberemok
