
Project Portfolio Management Dashboard in MS Power BI
Contents:
- Using the "Project Portfolio Management" dashboard in MS Power BI
- Setting up the "Portfolio interaction management" dashboard
- Chat
Using the "Project Portfolio Management" dashboard in MS Power BI
This MS Power BI Project Portfolio Dashboard provides a clean, intuitive, and highly functional solution tailored for executive oversight. Designed with simplicity and clarity in mind, it consolidates schedules, budgets, task statuses, and resource allocations into a single, interactive control panel.
Key Advantages & Executive Value
Built around the proven PM framework of Management by Exception, this dashboard allows executives to skip routine data checks and focus immediately on critical bottlenecks.
- Streamlined UI: Utilizes essential, easy-to-understand visuals without cluttering the screen with unnecessary complexity.
- Battle-Tested Expertise: Designed based on extensive practical experience in delivering real-world engineering, construction, and IT project portfolios.
- High-Level & Detailed Analytics: Provides an instant portfolio-wide health assessment while enabling deep-dive filtering into individual projects, tasks, or responsible team members.
Note to Colleagues: We are continuously refining this tool. If you have suggestions or ideas for enhancement, please feel free to share them in the comments under the video breakdown!
Data Architecture: Cost-Effective MS Project Pro Integration
This solution eliminates the need for expensive, heavy enterprise deployments like MS Project Server or Project Online.
How the Data Pipeline Works:
- Source Data: Project managers track and update individual schedules in MS Project Pro.
- Consolidation & Export: All project schedules are compiled into a master portfolio file and exported to a standard XML format.
- Central Storage: The XML file is hosted on a shared network directory or a corporate SharePoint/OneDrive folder.
- Automated Refresh: Power BI connects directly to this file, automatically refreshing all visual reports and key metrics upon demand.
Core Components: 7 Functional Dashboard Blocks
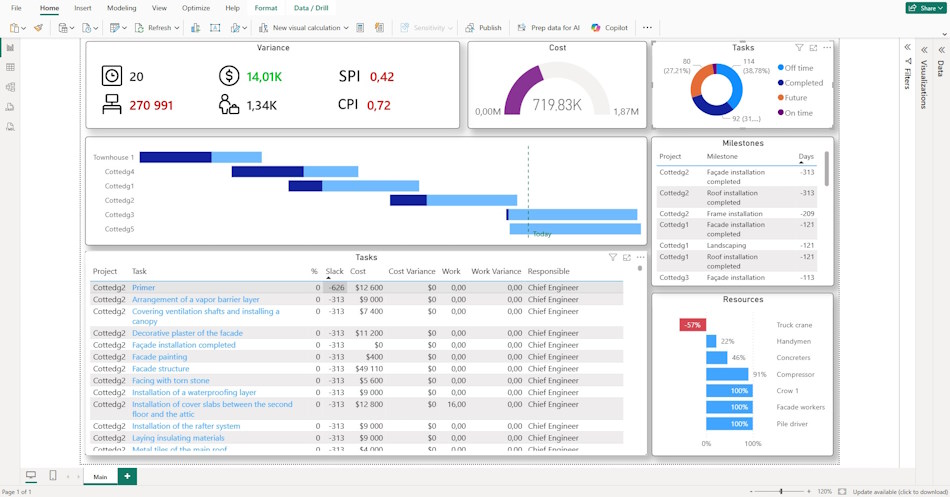
The dashboard layout is structured into 7 core modules that cover every essential aspect of project control:
1. Central Project List (Gantt Chart). Displays the active timeline and progress bars for all projects in the portfolio. It helps managers quickly evaluate planned vs. actual progress and verify the consistency and quality of schedule updates made by project leads.
2. Key Performance Indicators & Variance Block. An executive summary panel with dynamic, conditional color-coding:
- Core Variances: Tracks schedule variance (days), cost variance ($), and work/labor variance (hours).
- Financial Impact of Resource Underutilization: Calculates the direct financial cost incurred by the company due to resource downtime/underutilization for the current and upcoming month.
- Conditional Formatting Thresholds:
- Red: Variances exceeding 20% of baseline duration, budget, or work hours.
- Yellow: Variances between 10% and 20%.
- Green: Variances within normal limits (below 10%).
- Earned Value Management (EVM) Metrics:
- SPI (Schedule Performance Index): Measures schedule efficiency.
- CPI (Cost Performance Index): Measures budgetary efficiency.
- Threshold Rule: SPI or CPI values falling below 1.0 automatically highlight in red to signify off-track performance.
3. Cost & Budget Tracking. Visualizes cumulative spending across the portfolio or for a selected project. It compares total baseline budgets against actual spent costs to ensure financial predictability and prevent budget overruns.
4. Task Status Distribution (Donut Chart). Provides a clear visual breakdown of all tasks across four key operational categories:
- Completed: Fully finished work packages.
- Future: Upcoming scheduled tasks.
- On time: Active tasks progressing according to plan.
- Off time: Overdue tasks requiring immediate intervention.
5. Milestone Registry. A focused view of critical project milestones. Completed milestones are highlighted in green, while pending or delayed milestones display the exact number of days overdue relative to the current date.
6. Detailed Task Register. A comprehensive table detailing individual tasks, responsible leads (e.g., Chief Engineer, Project Manager), and status tracking. Clicking on any project or category on the dashboard automatically filters this table.
7. Resource Capacity & Allocation. Monitors resource allocation and workload distribution across the workforce and equipment for the current and next month:
- Overallocated Resources: Highlighted in red (indicating burnout and deadline risks).
- Underallocated Resources: Highlighted in blue (indicating available capacity for reallocation).
Setting up the "Project Portfolio Management" dashboard
How to get the report in MS Power BI
- Register or log in to this site.
- Make a payment.
- Download the report file.
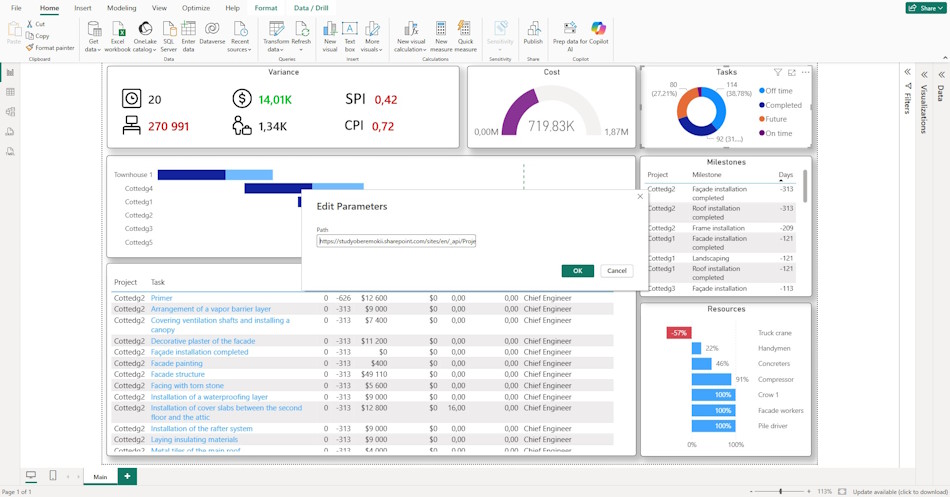
How to customize a report in MS Power BI
- Download MS Power BI from the link https://www.microsoft.com/en-us/download/details.aspx?id=58494.
- Install MS Power BI (consider the bitness of your operating system).
- Load MS Power BI and log in with your account.
- Open the report in MS Power BI.
- Go to the “Home” menu item and the “Transform data” sub-item.
- Go through all the tables and change the server address.
- To do this, click on the “Source” item and replace the line “https://studyoberemokii.sharepoint.com/sites/en/” with the address of your server.
- Go to the “Home” menu item and the “Update all” sub-item.
- In the same “Home” item, click the “Close and Apply” button.
Documents

Author: Ivan Oberemok
