
Risk analysis based on % completion in MS Project Server
Contents:
- Risk analysis based on % completion in MS Project Server
- Configuring the “Percentage Complete Analysis” columns in MS Project Server
- Configuring the Task Tracking view in MS Project Server
- Chat
Risk analysis based on % completion in MS Project Server
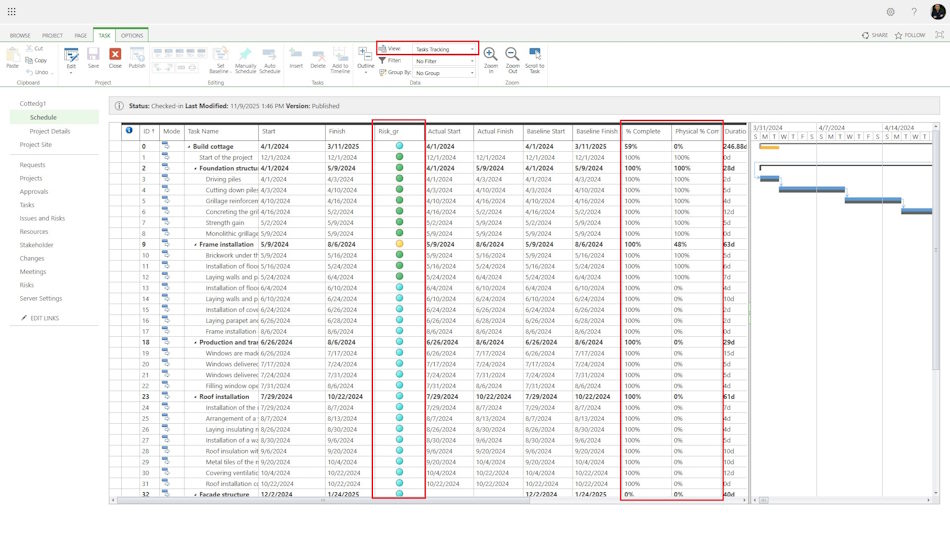
By analyzing the ratio of the percentage of task completion by duration to the percentage of completion by volume, we can draw conclusions about the level of risk of the task. Let's highlight three levels of risk:
- If the amount of time spent is less than the closed volume, then the level of risk is minimal (green).
- If the amount of time spent is greater than the closed volume, but not more than half, then the risk level is medium (yellow).
- If the amount of time spent is more than twice the closed volume, then the risk level is high (red).
Configuring the “Percentage Complete Analysis” columns in MS Project Server
To setting up earned value columns:
- Select the “Server Settings” menu item.
- Go to “Enterprise Custom Fields and Lookup Tables”
- In the “Enterprise Custom Fields” table, click the “New Field” button.
- In the window that opens, enter a unique name for the custom field in the “Name” field.
- Under “Entity and Type select:
- Entity - Tasks.
- Type - Number.
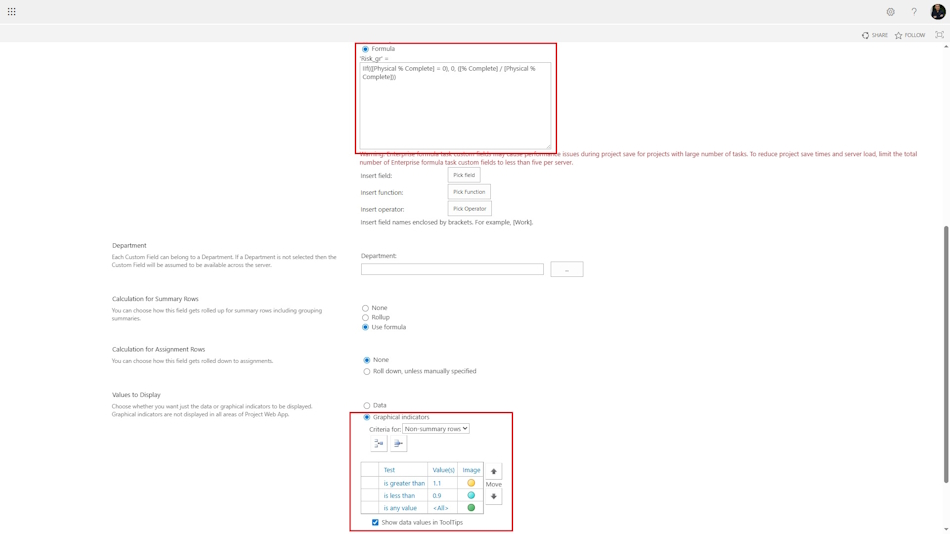
- In “Custom Attributes,” click the “Formula” button and insert the required field. For example, "IIf(([Physical % Complete] = 0), 0, ([% Complete] / [Physical % Complete]))".
- In “Values to Display” configure the graphical indicator. For example, indicator conditions:
- is greater than 1.1 - red yellow,
- is less than 0.9 - blue,
- is any value - green.
- Check the box next to “Show data values in tooltips.” In “Display values,” set the conditions for the graphical indicators for: “Total rows” and “Total project tasks.”
Configuring the Task Tracking view in MS Project Server
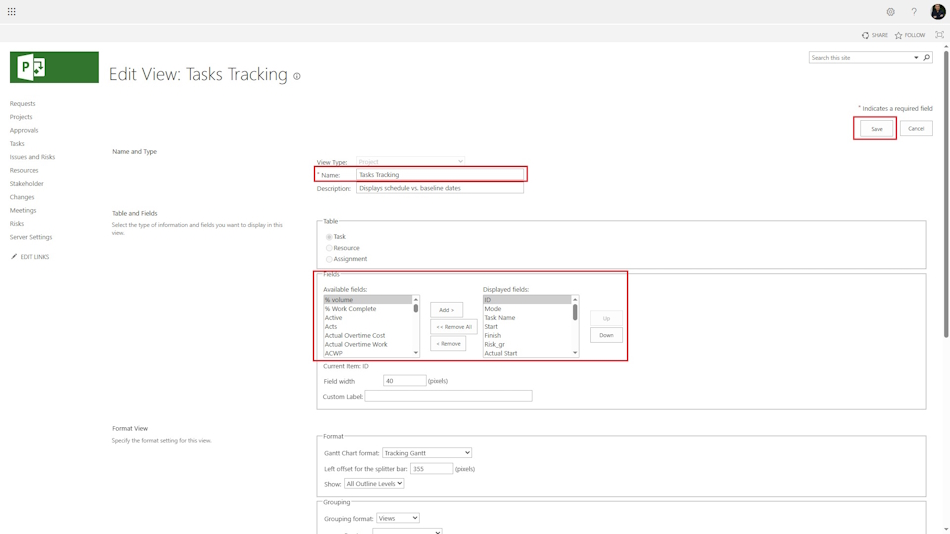
To customize the “Task Tracking” view:
- Select the “Server Settings” menu item.
- Go to “Manage View”
- Find the “Task Tracking” view in the “Manage View” table.
- In the “Edit View: Task Tracking” window, in the “Table and Fields” section, add the custom fields created above from the “Available fields:” list to the “Displayed fields” list.
- Save the created view.
#projectmanagment, #projectscopemanagement, #projectschedulemanagement, #monitoringandcontrollingprocess, #msprojectserver, #oberemokii, #projectriskmanagement

Author: Ivan Oberemok
