
Project Earned Value Method in MS Project Server
Contents:
- Project Earned Value method in MS Project Server
- Resources Earned Value method in MS Project Server
- Setting up the Earned Value view in MS Project Server
- Setting up Earned Value сolumns in MS Project Server
- Chat
Project Earned Value method in MS Project Server
To analyze the completed volume in a project in MS Project Server, you can use the classic “Completed Volume” view:
On the project page, go to the “Schedule” sheet. Select the “View:” menu item and “Tasks Earned Value” from the drop-down list.
The following columns can be used in the classic view:
- BCWP (BAC) – Budget at Completion. The Budget at Completion (BAC) is the total planned budget for the entire project. It represents how much the project is expected to cost when all planned work is completed according to the baseline plan.
- BCWS – base cost of tasks completed from the start of the project to the status report date.
- ACWP – actual cost of tasks completed from the start of the project to the status report date.
- CV – Cost Variance. Measures the difference between the earned value and the actual cost. It shows whether the project is under or over budget..
- CV > 0 → under budget (cost saving).
- CV < 0 → over budget (cost overrun).
- CPI - Cost Performance Index. Indicates the cost efficiency of the project — how effectively the budget is being spent.
- CPI = 1 → on budget.
- CPI > 1 → spending efficiently.
- CPI < 1 → spending inefficiently.
- SV – Schedule Variance. Measures the difference between earned value and planned value. It shows whether the project is ahead or behind schedule.
- SV > 0 → ahead of schedule.
- SV < 0 → behind schedule.
- CVP – Cost Variance Percentage.Represents cost variance as a percentage of earned value.
- CVP > 0 → cost saving.
- CVP < 0 → cost overrun.
- EAC - Estimate at Completion. Forecast of the total cost of the project at completion, based on current performance.
- EAC > BAC → project expected to exceed budget.
- EAC < BAC → project expected to finish under budget
- VAC - Variance at Completion. Difference between the original budget and the current estimate at completion.
It predicts the final cost variance.- VAC > 0 → expected underrun (savings).
- VAC < 0 → expected overrun (overspend).
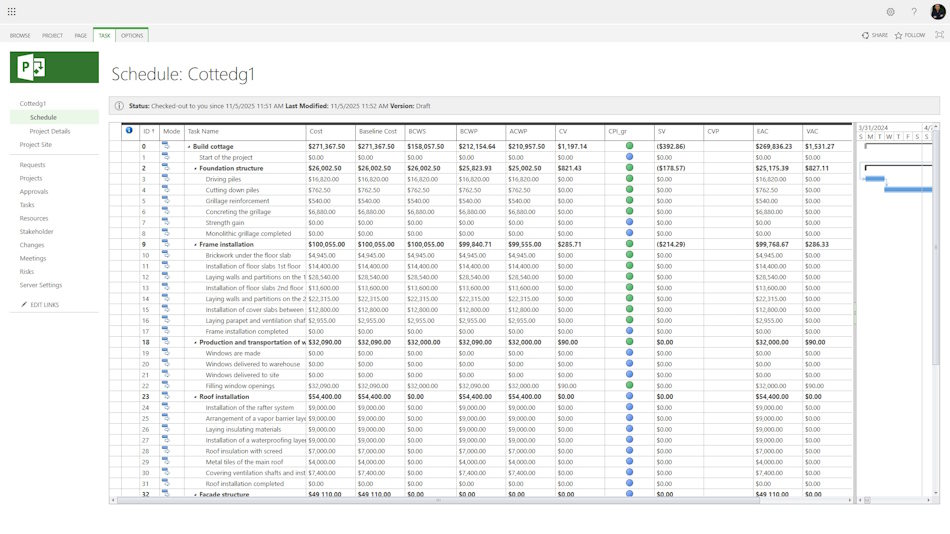
Having the values of PV (Planned Value), EV (Earned Value), and AC (Actual Cost), it is possible to analyze the project by the following parameters — SPI (Schedule Performance Index) and CPI (Cost Performance Index) — to identify schedule and cost variances in a cost-based format.
Deviations can also be visualized using configured indicators such as SV (Schedule Variance) and CV (Cost Variance), which allow you to assess schedule and cost deviations in a numerical format.
Resources Earned Value method in MS Project Server
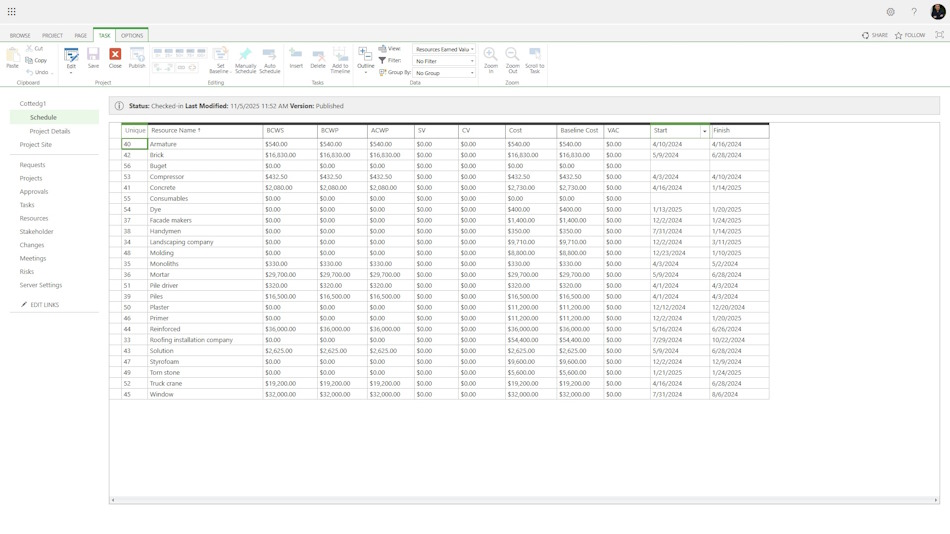
In the “Resource Earned Value” view, key indicators of earned value are displayed for each project resource. It shows how much cost was originally planned for every resource, how much of the approved resources have been actually used, and the total amount of funds spent in reality. This view does not include numeric indicators such as CPI and SPI. For better analysis and visualization, resources can be grouped according to the Work Breakdown Structure of Resources (WBS-Res).
Setting up the Tasks Earned view in MS Project Server
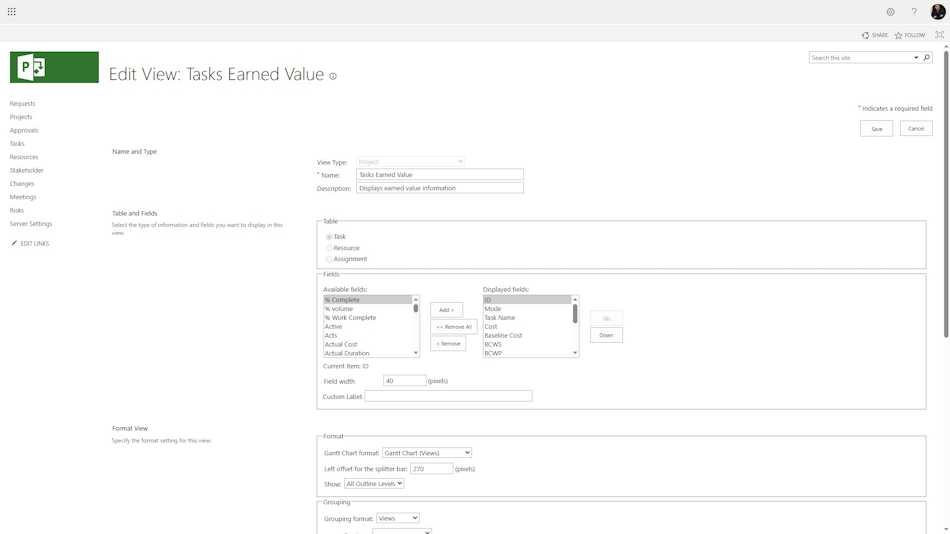
To customize the “Tasks Earned Value” view:
- Select the “Server Settings” menu item.
- Go to “Manage Views”
- Find the “Tasks Earned Value” view in the “Manage Views” table.
- In the “Edit View: Tasks Earned Value” window, in the “Table and Fields” section, add the custom fields created above from the “Available fields:” list to the “Displayed fields” list.
- Save the created view.
Setting up Earned Value сolumns in MS Project Server
To setting up earned value columns:
- Select the “Server Settings” menu item.
- Go to “Enterprise Custom Fields and Lookup Tables”
- In the “Enterprise Custom Fields” table, click the “New Field” button.
- In the window that opens, enter a unique name for the custom field in the “Name” field.
- Under “Entity and Type select:
- Entity - Project.
- Type - Number.
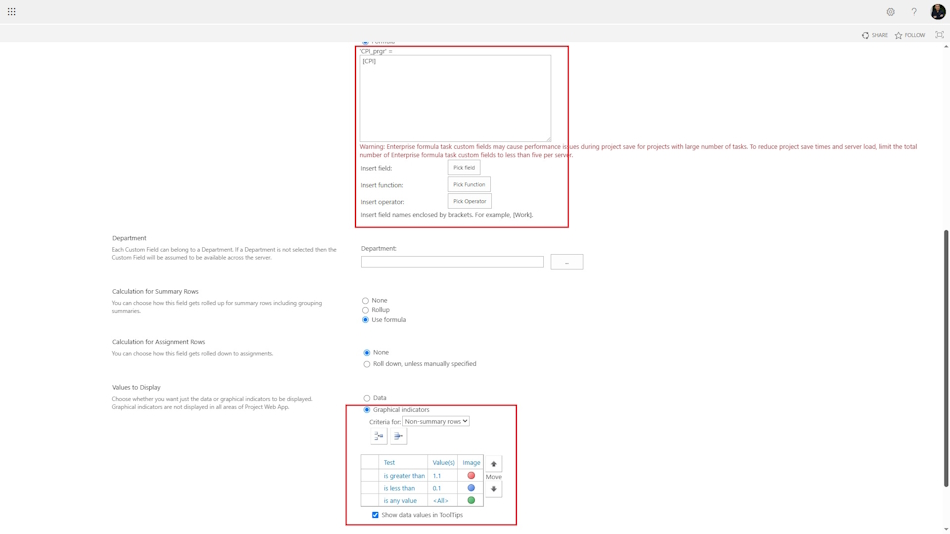
- In “Custom Attributes,” click the “Formula” button and insert the required field. For example, "CPI".
- In “Values to Display” configure the graphical indicator. For example, indicator conditions:
- is greater than 1.1 - red indicator,
- is less than 0.9 - blue,
- is any value - green.
- Check the box next to “Show data values in tooltips.” In “Display values,” set the conditions for the graphical indicators for: “Total rows” and “Total project tasks.”

Author: Ivan Oberemok
