
Indicators of mastered volume of server project portfolio in MS Power BI
Contents:
- Indicators of mastered volume of server project portfolio in MS Power BI
- Customize dashboard “Indicators of mastered project portfolio volume” of the server in MS Power BI
- Chat
Indicators of mastered volume of server project portfolio in MS Power BI
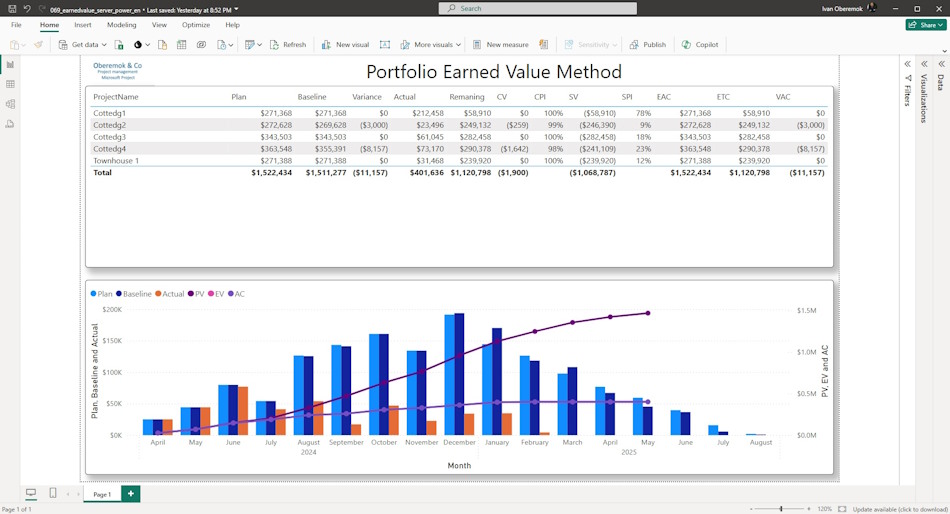
The utilized volume methodology allows to assess the efficiency of project implementation based on the data of base plans and actual project costs. The calculation is performed as of the start date of the current month. Correct indicators require mandatory saving of the base plan and regular updating of project schedule plans with mandatory setting of actual values. For the presented dashboard the information is taken from MS Project Server server.
The dashboard solves the following tasks:
- Evaluation of efficiency of portfolio projects realization.
- Estimation of financial means utilization in portfolio projects implementation.
- Estimation of portfolio projects realization efficiency by terms.
- Calculation of portfolio projects' costs taking into account the efficiency of their realization.
On the dashboard page you can analyze the efficiency of project implementation by the following indicators:
- Base - approved project costs.
- Plan - current planned project costs.
- Deviation - the difference between approved and planned indicators.
- Actual - the actual costs of the projects.
- Remaining - the difference between planned and actual. Costs we have yet to pay.
- CV - cost management performance measure.
- CPI - cost performance index.
- SV - an index for assessing the effectiveness of time management.
- SPI - schedule performance index.
- EAC - projected cost of the project taking into account cost management performance.
- ETC - cost estimate for remaining work.
- VAC - deviation from the approved cost plan.
The graph shows the following values by period:
- Base - approved project costs.
- Plan - current planned costs of the projects.
- Actual - actual project costs.
- PV - planned volume for the period.
- AC - actual costs for the period.
- EV - utilized volume for the period.
Customize dashboard “Indicators of mastered project portfolio volume” of the server in MS Power BI
How to get the report in MS Power BI
- Register or log in to this site.
- Make a payment.
- Download the report file.
How to customize a report in MS Power BI
- Download MS Power BI from the link https://www.microsoft.com/en-us/download/details.aspx?id=58494.
- Install MS Power BI (consider the bitness of your operating system).
- Load MS Power BI and log in with your account.
- Open the report in MS Power BI.
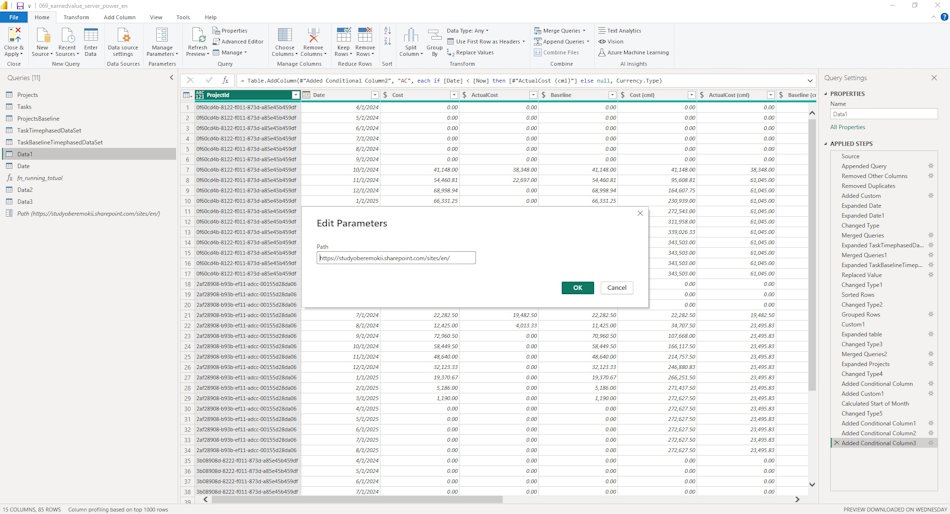
- Go to the “Home” menu item and the “Transform data” sub-item.
- Click on the “Path” item and replace the line “https://studyoberemokii.sharepoint.com/sites/en/” with the address of your server.
- Go to the “Home” menu item and the “Update all” sub-item.
- In the same “Home” item, click the “Close and Apply” button.
#projectportfoliomanagement, #programmanagement, #projectcostmanagement, #planningprocess, #monitoringandcontrollingprocess, #msprojectserver, #mspowerbi, #oberemokii, #documents
Documents
Documant title: Dashboard “Indicators of mastered project portfolio volume” of the server in MS Power BI
Price: € 15 / 780 UAH
Description: The dashboard with volume utilization indicators allows to evaluate the efficiency of the project portfolio implementation using a common set of metrics. It assesses the use of finances and the fulfillment of project objectives. In addition, it calculates

Author: Ivan Oberemok
