
Customer cost planning and analysis in MS Excel
Contents:
- Customer cost planning in MS Excel
- Analysis of deviations between customer costs and project budget
- Set up the dashboard "Customer cost planning and analysis" of the server in MS Excel
- Chat
Customer cost planning in MS Excel
Quite often before the realization of a project, we provide the customer with a calculation of the cost of the project work on key tasks. The purpose of providing this information is to show how the price is formed during project realization. In the future, we form a payment plan for project work by periods based on the proposed calculation. Distribution of customer's costs by periods is done approximately, which often leads to conflicts and misunderstandings. To solve this problem we offer to use this dashboard developed in MS Excel. Based on the cost of works for each period, the dashboard distributes the customer's costs for all periods of the project realization. As we work with MS Project Server data, where the project portfolio is placed. We can plan payments for all projects of the portfolio.
Dashboard solves the following tasks:
- Distribution of project customers' costs by periods.
- Analyzing the quality of budget planning of the portfolio projects.
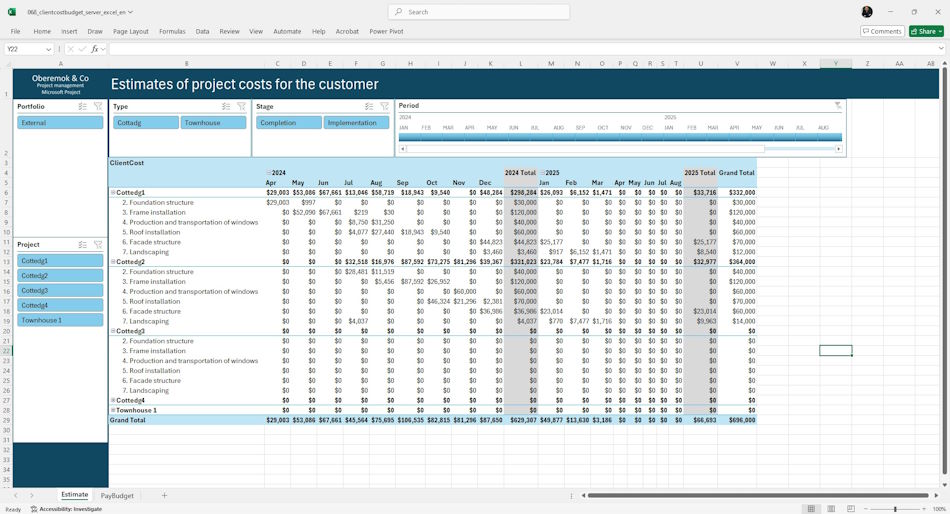
- On the “Estimates” dashboard page you can analyze the distribution of project customers' costs by periods.
The table contains the following fields:
- Project name.
- Top-level tasks.
The columns show the value of customer's costs by periods.
The following filters are used on the page:
- Portfolio - filter by project portfolio.
- Project - filter by project name.
- Type - filter by project type.
- Stage - filter by project stages.
- Period - filter by time period.
Analysis of deviations between customer costs and project budget
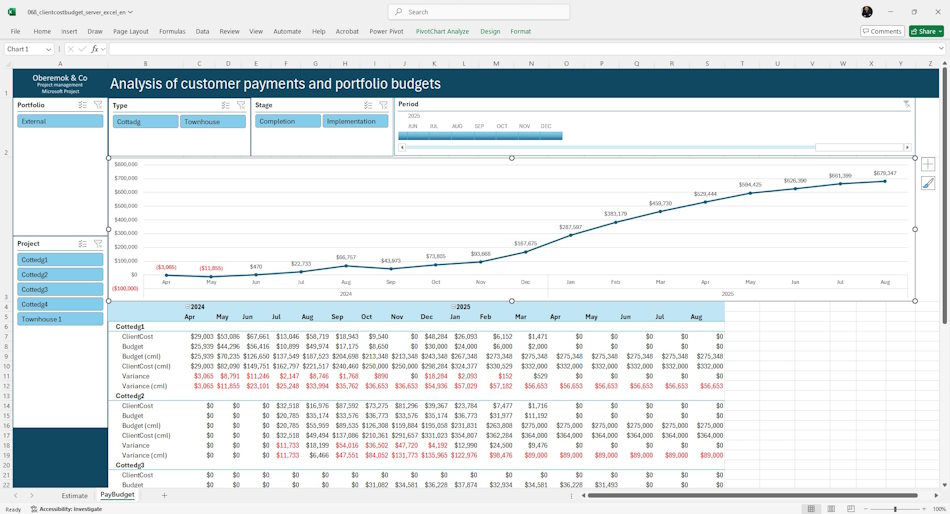
You can transfer the payment plan proposed by the dashboard to the budget resource of the project. There in the budget resource you can record actual payments and reschedule payments for future periods. The page “Estimate (client) and Budget” displays information about client costs and budgets both for the period and cumulatively. In addition, the difference between client's costs and project budgets is displayed. As a result, by tracking the value of the variance cumulative indicator we can control the quality of budget planning in projects.
The column displays the information:
- Project name.
- Cost for the customer - the distributed amount of costs for the customer of the project.
- Budget - the sum of planned and actual payments of the customer in the budget resource of the project.
- Deviation - the difference between the cost for the customer and the project budget.
- Cost to customer (n/a) - the allocated amount of costs for the customer of the project on an accrual basis.
- Budget (n/a) - the sum of planned and actual payments of the customer in the budget resource of the project cumulatively.
- Deviation (nr) - the difference between the cost for the customer and the project budget cumulatively.
The graph outputs cost deviations by cumulative total. The ideal line is drawn to zero.
The following filters are used on the page:
- Portfolio - filter by project portfolio.
- Project - filter by project name.
- Type - filter by project type.
- Stage - filter by project stages.
- Period - filter by time periods.
Set up the dashboard "Customer cost planning and analysis" of the server in MS Excel
How to get the report in MS Excel
- Register or log in to the site.
- Make a payment.
- Download the report file.
How to customize a report in MS Excel
- Load MS Excel and log in with your account.
- Open the report in MS Excel.
- Go to the “Data” menu, the “Get data” item and the “Launch Power Query editor” sub-item.
- Click on the “Path” item and replace the line “https://studyoberemokii.sharepoint.com/sites/en/” with the address of your server.
- Go to the “Home” menu item and the “Update preview” sub-item.
- In the same “Home” item, click the “Close and Apply” button.

Documents

Author: Ivan Oberemok
