
The labor resources project report in MS Project Pro
Contents:
- The project labor report in MS Project Pro
- Customize the “Labor Resources” report in MS Project Pro
- Chat
The project labor report in MS Project Pro
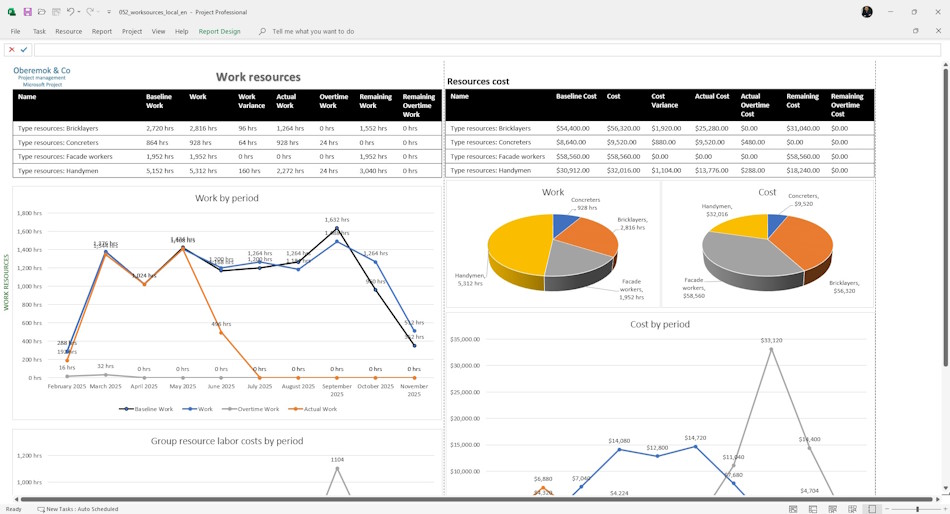
The purpose of the report is to monitor the quality of planning and use of project labor resources. The report is used by project office specialists and project team members responsible for project labor management.
The report solves the following tasks:
- To assess the quality of labor resources planning in the project. Analyze the deviation of approved values from planned values.
- Evaluate the use of labor resources in the project. Analyze the deviation of approved planned from actual.
- Evaluate the cost of attracting labor resources to the project.
The report includes:
- A table with general information on project labor.
- Graph with distribution of labor input indicators by periods
- Schedule of distribution of planned labor inputs of labor resource groups by periods.
- Table of labor cost indicators of labor resource groups.
- Graphs of labor and cost shares by resource groups
- Graph of distribution of planned costs of resource groups by periods.
- In the table with general information about resource labor inputs, the labor inputs for the resource groups of the project are displayed. We suggest using the following fields for this purpose:
Resource type name - the name of the project resource group.
- Baseline work - the basic labor costs of the resource group.
- Work - planned labor costs of the resource group.
- Overtime work - the overtime labor costs of the resource group.
- Work variance - the difference between the planned and approved labor inputs of a resource group.
- Actual work - actual labor inputs of the resource groups of the project.
- Remaining work - the difference between planned and actual labor inputs of resource groups.
The “Work by period” graph shows the labor rates by month. On this graph you can monitor the peak values of resource labor costs. By analyzing the peaks you can propose optimizations to reduce them. The graph shows the following indicators:
- Baseline work - the base labor costs of the project.
- Work - planned labor costs of the project.
- Actual work - Actual labor costs of the project.
- Overtime work - overtime labor costs of the project.
The “Group resources costs by period” graph shows the planned labor costs of resource groups by month.
In the table with general information about resource costs, the cost indicators for the resource groups of the project are displayed. We suggest using the following fields for this purpose:
- Resource type name - name of the project resource group.
- Baseline cost - the base costs of the resource group.
- Cost - the planned costs of the resource group.
- Cost variance - the difference between the planned and approved costs of the resource group.
- Actula overtime cost - resource group actual overtime labor costs.
- Actual cost - costs of resource groups actually spent during project realization.
- Remaining cost - the difference between planned and actual costs of resource groups.
The “Work” graph shows the labor share of each project resource group.
The “Cost” graph shows the share of costs for each resource group in the project.
The “Cost by Period” graph shows the planned cost values of the resource groups by month.
Customize the “Work resources” report in MS Project Pro
How to get the “Labor Resources” report in MS Project Pro:
- Register or log in.
- Make a payment.
- Download the schedule with the report.
Customize the “Material Resources” report in MS Project Pro:
- Open the schedule plan with the report.
- Go to the Organizer section
- Copy the “Resource Type” field
- Fill it with your resources.
- Copy the “Resource Type” groups for the resources.
- Copy the “Work resources” report to your project or “Global.mpt” project
- Open the report and verify the report works.

Documents
- Send email: info@pmhub.pro
- Write to Telegram: +38 (097) 906-95-62. Send request
- Write on Whatsapp: +38 (097) 906-95-62. Send request
- Write on Viber: +38 (097) 906-95-62. Send request
- Call the phone: +38 (097) 906-95-62

Author: Ivan Oberemok
