
Analysis of warehouse materials and server project portfolio in MS Excel
Contents:
- Dashboard on analyzing the use of material resources of the server project portfolio in MS Excel
- Customize dashboard “Analysis of warehouse materials and project portfolio” in MS Excel
- Chat
Dashboard on analyzing the use of material resources of the server project portfolio in MS Excel
An extension of the classic dashboard on planning and use of materials in the project portfolio is the dashboard where we also analyze data on materials in the project and company warehouses. Materials can be delivered to a project according to a separate procurement plan, which provides materials for all projects in the portfolio. The materials are subsequently transferred to the construction sites. Supply planning can be done either in special software or in MS Excel or MS SharePoint spreadsheets. For our dashboard we used lists to MS SharePoint. The dashboard also uses payments for received materials.
The dashboard solves the following tasks:
- Planning and fixing the receipt of material resources.
- Planning and fixing payments for material resources.
- Analyzing the quality of planning of material resources.
- Analyzing payments for material resources.
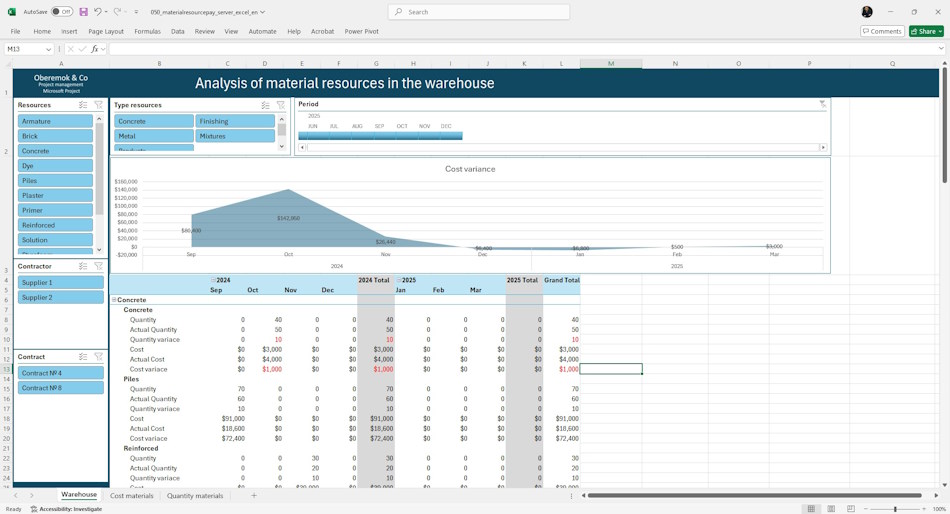
On the “Warehouse” dashboard page you can analyze the quality of planning and receipt of materials in project warehouses. The analysis is based on quantitative and cost indicators. By comparing planned and actual indicators, we evaluate the quality of fulfillment of the procurement plan.
The table contains the following fields: resource type (resource group) and resource name.
The following indicators are displayed in the columns.
- Quantity (plan) - the number of resources planned for purchase.
- Quantity (actual) - the number of resources actually purchased.
- Quantity deviation - the difference between the planned and actual quantities of purchased materials.
- Amount (plan) - cost of resources planned for purchase.
- Amount (actual) - cost of actually purchased resources.
- Cost deviation is the difference between planned and actual costs of purchased materials.
The graph shows deviations in material costs by period.
The following filters are used on the page:
- Resource name - filter by resource names.
- Counterparty - filter by resource suppliers.
- Contract - filter by material supply contracts.
- Resource type - filter by material resource type.
- Period - filter by period for which material resources are assigned.
Analysis of payments and cost of materials in the company's warehouses
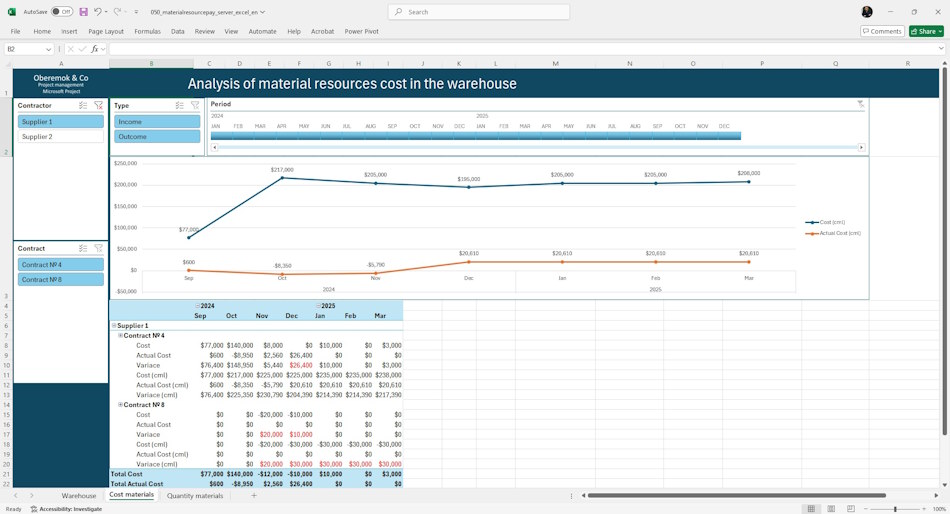
The Material Costs dashboard page shows the payments for material purchases and the cost of materials in stock. You can control the quality of planning and utilization of the procurement plan and material payments for projects. The value of payments is shown with a negative value, and the cost of materials with a positive value. Thus, when grouping the values, a negative value means that the company has paid, but has not received the materials for this amount, if the value is positive, the materials have been received, but have not been paid for the specified amount. In addition, there are output indicators with increasing total, to analyze the real indebtedness between the company and suppliers in each period.
In the rows of the table the information is displayed: supplier of materials, contract and group of values (materials and payments).
The columns display the information:
- Plan - planned amount paid or cost of materials.
- Actual - paid amount or value of materials received.
- Deviation - the difference between plan and actual costs.
- Plan (cml) - planned amount paid or cost of materials cumulatively.
- Actual (cml) - the amount paid or cost of materials received cumulatively.
- Deviation (cml) - the difference between plan and actual costs cumulatively.
The graph should display planned and actual values by increasing total. Ideally, these values should tend to zero (no one owes anyone).
The following filters are used on the page:
- Counterparty - filter by companies that supply materials.
- Contract - filter by supply contracts.
- Stage - filter by stages of portfolio projects.
- Type - filter that displays payments and costs of materials separately.
- Period - filter by the periods for which material resources are assigned.
Analysis of material quantities in warehouses and portfolio projects
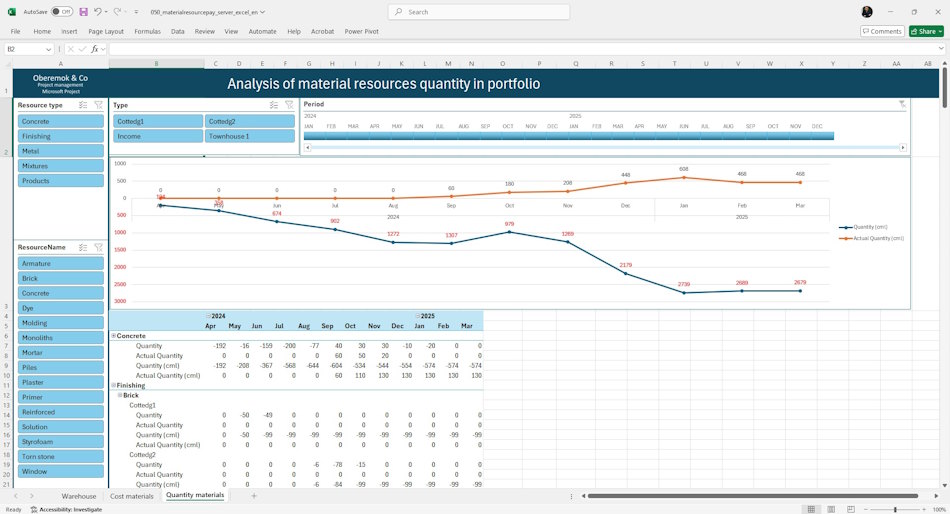
The “Material quantity” dashboard page provides information about the amount of various materials in the company's warehouses and their availability in projects. You can control how much the projects are provided with materials for realization. Information about planned purchases of materials and actually received, as well as information about plans of their use and actually used. The value of the quantity in the project is indicated with a negative value, and the quantity of materials in the warehouses with a positive value. Thus, when grouping the values, a negative value means that there are not enough materials for the projects, while a positive value means that there is a surplus of materials. In addition, the indicators are displayed with increasing total, to analyze the demand for materials in dynamics, taking into account previous periods.
The following information is displayed in the table rows: Material type, name of materials, name of projects or warehouses.
The columns display information:
- Plan - planned quantity of materials.
- Actual - quantity of materials received or used.
- Deviation - difference between plan and actual costs.
- Plan (cml) - planned quantity of materials cumulatively.
- Actual (cml) - received or used quantity of materials cumulatively.
- Deviation (cml) - difference between plan and actual costs cumulatively.
The graph should display planned and actual values by increasing total. Ideally, these values should tend to zero (no one owes anyone).
The following filters are used on the page:
- Counterparty - filter by companies that supply materials.
- Contract - filter by supply contracts.
- Stage - filter by stages of portfolio projects.
- Type - filter that displays payments and costs of materials separately.
- Period - filter by the periods for which material resources are assigned.
Customize dashboard “Analysis of warehouse materials and project portfolio” in MS Excel
- Register or log in.
- Make a payment.
- Download the file with the report.
How to customize the dashboard in MS Excel
- Download MS Excel and log in with your account.
- Open the report in MS Excel.
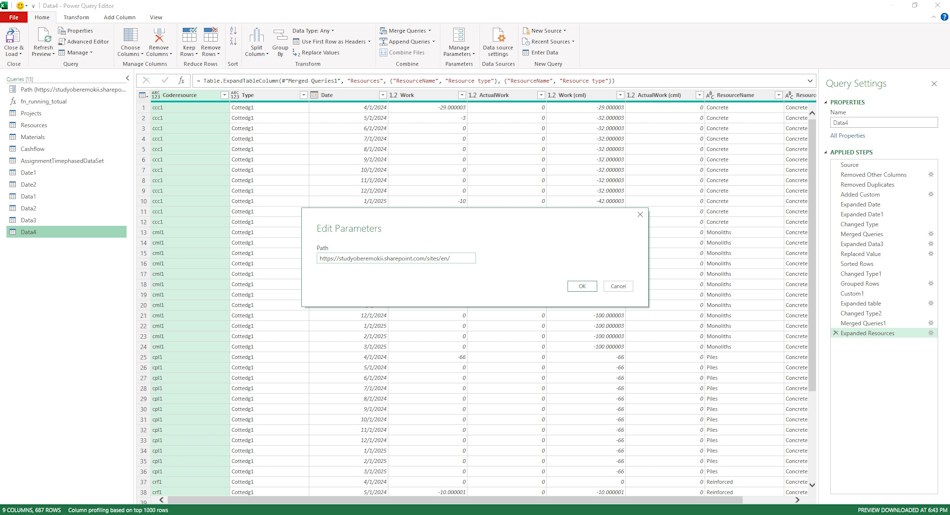
- Go to “Data” menu, “Get Data” item and sub-item “Launch Power Query Editor”.
- To do this, click on the “Path” parameter and replace the line “https://studyoberemokii.sharepoint.com/sites/en/” with your server address.
- Go to the “Home” menu item and the “Refresh Preview” sub-item.
- Refine the portfolios and portfolio types in the “Projects” table and the resource groups in the “Resources” table.
- In the same “Home” menu item, click the “Close & Load” button.

Author: Ivan Oberemok
