
Analysis of material resources of the server project portfolio in MS Excel
Contents:
- Dashboard on analyzing the use of material resources of the server project portfolio in MS Excel
- Customize dashboard “Analysis of material resources of project portfolio” in MS Excel
- Chat
Dashboard on analyzing the use of material resources of the server project portfolio in MS Excel
The purpose of the report is to monitor the quality of planning and use of material resources of the company during the implementation of the project portfolio. The report is used by project office specialists and members of project teams responsible for material resources management. The main tasks of the report:
- To control the quality of resource planning and utilization by quantity and cost indicators.
- Control of materials utilization by periods.
- Control of costs of resource groups by periods.
As a result of the analysis to propose measures for re-planning of material resources in the portfolio projects.
Material Resource Utilization Analysis
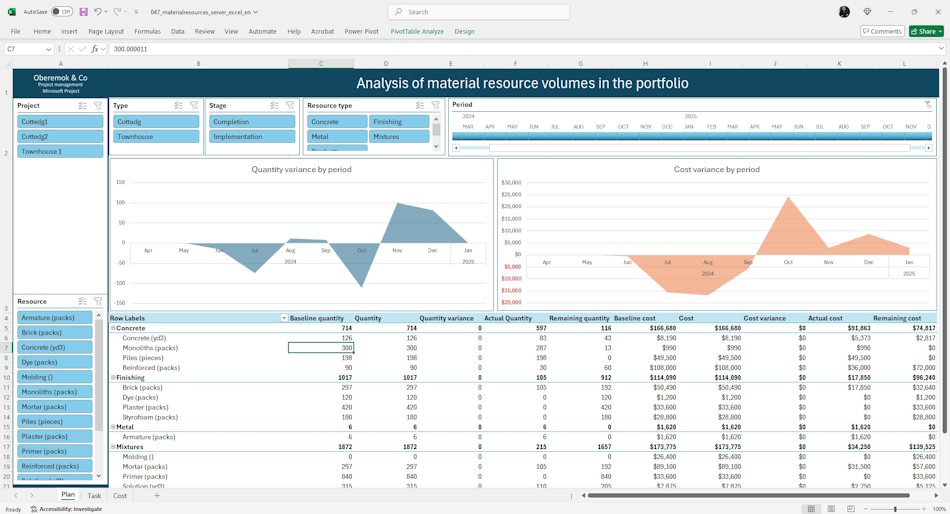
On the “Plan” dashboard page, the following indicators of material resource utilization in the portfolio are presented:
- Name of resource type - name of resource group.
- Resource name - the name of the resource group.
- Approved quantity - the quantity of resources agreed with management.
- Planned quantity - the quantity of resources after the project plans have been specified.
- Quantity deviation - the difference between the approved and planned quantity of material resources.
- Actual quantity - the actual amount of material resources used in the realization of the task.
- Remaining quantity - the amount of material resources that remained unused.
- Base costs - approved costs of resources.
- Planned costs - planned costs of resources.
- Cost deviation - the difference between planned and approved resource costs.
- Actual costs - costs of resources actually spent during project implementation.
- Remaining costs - the difference between planned and actual resource costs.
The charts show deviations from the approved values by the amount and costs of resources distributed by periods.
The following filters are used on the page:
- Project type - filter by project type.
- Project - filter by portfolio projects.
- Stage - filter by project stages of the portfolio.
- Resource type - filter by types of material resources of the company.
- Resources - filter by individual corporate material resources of the company.
- Period - filter by the periods for which material resources are assigned.
Analyzing the quantity of material resources
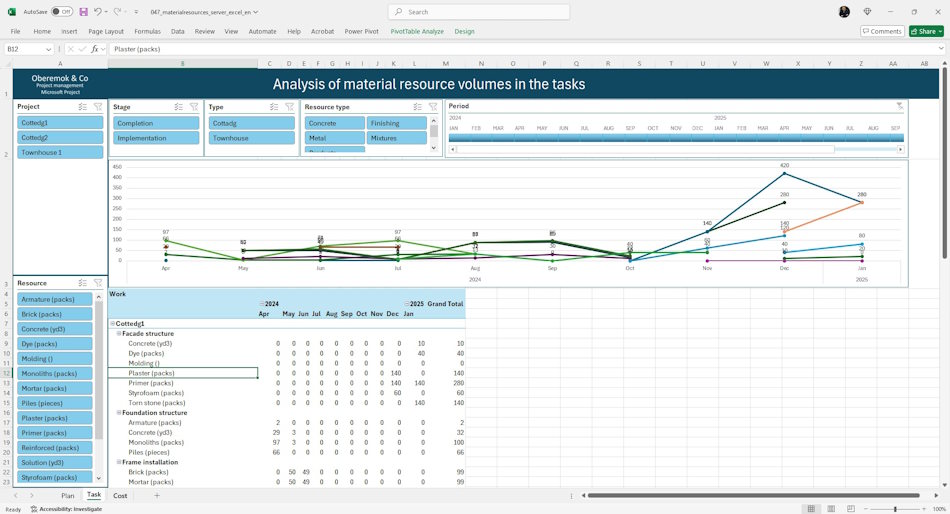
The “Tasks” dashboard page shows the material resources used in the top-level tasks of the projects. On this page you can compare what material resources are used to implement the same type of tasks in the portfolio projects and make a conclusion about the efficiency of using material resources by different project teams.
The table contains the following fields:
- Project name - name of the project in the portfolio.
- Task name - name of the top-level task of the project.
- Resource name - name of material resources.
The columns show the planned amount of resources by periods.
The following filters are used on the page:
- Type - filter by project type.
- Project - filter by portfolio projects.
- Stage - filter by project stages of the portfolio.
- Resource type - filter by types of material resources of the company.
- Resources - filter by individual corporate material resources of the company.
- Period - filter by the periods for which material resources are assigned.
Analyzing material resource utilization
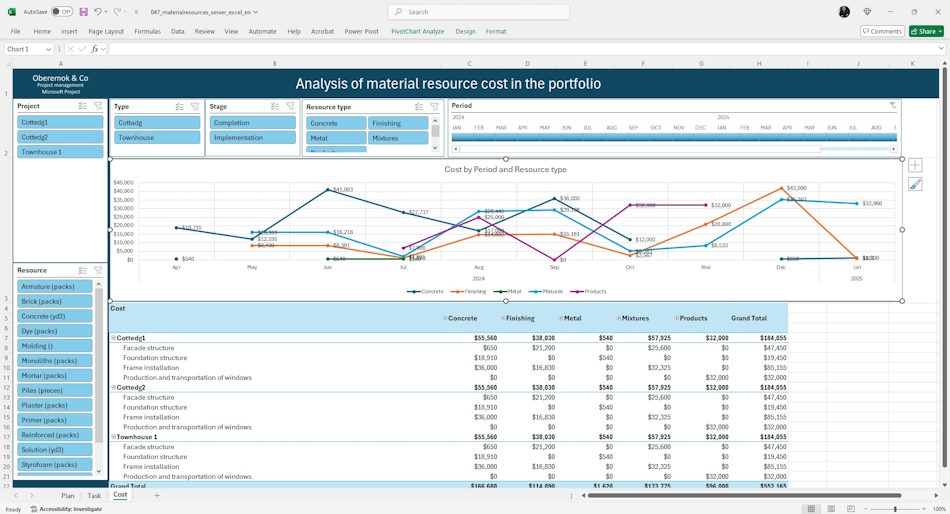
The “Costs” dashboard page presents costs by resource groups, by projects and by top-level tasks. The task of the page is to analyze the costs of resource groups used to implement top-level tasks. By comparing costs the project office can find both possible risks and prospects for savings.
The table contains information about planned costs.
The rows of the table contain the following information:
- Project name
- Name of top level tasks
The columns of the table contain the following information:
- Resource groups
- Resource name
The graph displays the costs of material resource groups by time periods. The graph makes it possible to analyze the peak costs of different groups of resources.
The following filters are used on the page:
- Type - filter by project type.
- Project - filter by portfolio projects.
- Stage - filter by project stages in the portfolio.
- Resource type - filter by types of material resources of the company.
- Resources - filter by individual corporate material resources of the company.
- Period - filter by the periods for which material resources are assigned.
Customize dashboard “Analysis of material resources of project portfolio” in MS Excel
- Register or log in.
- Make a payment.
- Download the file with the report.
How to customize the dashboard in MS Excel
- Download MS Excel and log in with your account.
- Open the report in MS Excel.
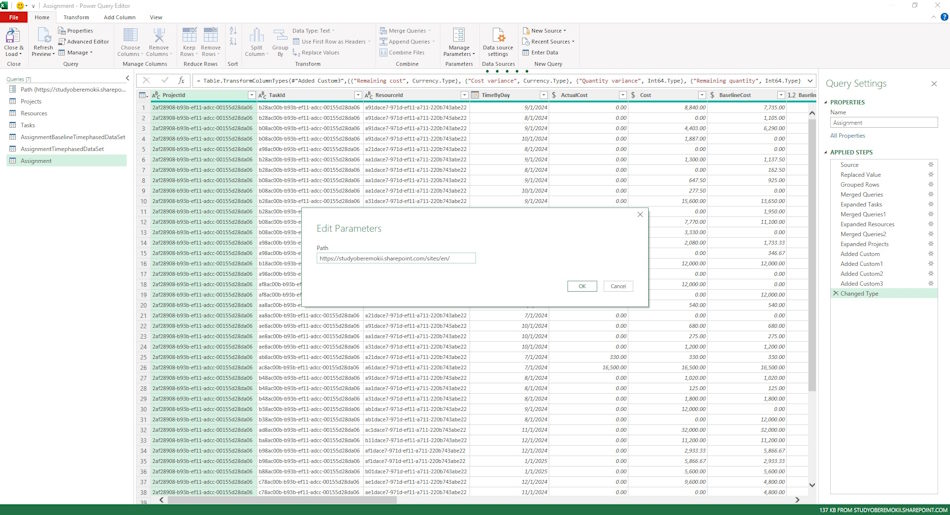
- Go to “Data” menu, “Get Data” item and sub-item “Launch Power Query Editor”.
- To do this, click on the “Path” parameter and replace the line “https://studyoberemokii.sharepoint.com/sites/en/” with your server address.
- Go to the “Home” menu item and the “Refresh Preview” sub-item.
- Refine the portfolios and portfolio types in the “Projects” table and the resource groups in the “Resources” table.
- In the same “Home” menu item, click the “Close & Load” button.
Documents

Author: Ivan Oberemok
