
Control portfolio timing and scope in dashboard in MS Power BI
Contents:
- Control portfolio timing and scope in dashboard in MS Power BI
- S-curve of projects
- Project results and current project tasks
- Tasks for the current months
- Customize dashboard “Control of project portfolio terms and volumes” in MS Power BI
- Chat
Control portfolio timing and scope in dashboard in MS Power BI
The purpose of the project portfolio control dashboard is to show the status of the projects. Management in turn must make decisions to intervene in project management or to continue implementation without change.
The presented dashboard allows you to control the timing and scope of portfolio projects. The “Main” page displays general information about the portfolio projects. To describe the current situation, we suggest to specify the following items:
- Project - project name.
- Project manager - name of the project manager.
- % plan - planned percentage calculated by MS Project Pro on the basis of data on the actual start of project realization and current date.
- % duration - percentage of project completion by time. The information is calculated by MS Project Pro on the basis of actual duration of tasks and start and end dates. Suitable for all projects and organizations that expect projects to be completed as soon as possible.
- % duration variance - the difference between the planned percentage and the percentage of project duration. This field shows the quality of the update of project task timelines.
- % scope - the percentage of project tasks completed by the Chief Engineer and responsible specialties in the subject area. The indicator shows the subjective assessment of the responsible project specialists of the level of readiness of project products.
- % scope variance - the difference between the planned percentage and the percentage scope. This field shows the quality of the update of project task scope.
- Start - start date of the projects.
- Finish - the planned completion date of the projects.
- Finish variance - shows how far the planned completion date has deviated from the approved completion date.
- Duration - indicator of the current planned duration of projects.
- Actual duration - indicator of the actual duration of projects.
The “Top level tasks” section displays a table of top-level tasks in projects. The following columns are presented to describe the tasks:
- Project - project name.
- % plan - planned percentage is calculated based on the actual start of the task and the current date.
- % duration - percentage of task completion by time.
- % duration variance - the difference between the planned percentage and the percentage of task duration. This field shows the quality of updating of task deadlines.
- % scoupe - percentage of project tasks completion completed by the Chief Engineer and responsible specialties in the subject area. The indicator shows the subjective assessment of the responsible project specialists of the level of readiness of the project products.
- % scope variance - the difference between the planned percentage and the percentage by volume. This field shows the quality of updating of task volumes.
- WBS - value of the project work decomposition structure code for top-level tasks.
- Task - name of the top-level tasks.
- Responsible - name or role of the task responsible.
- Duration - an indicator of the current planned duration of tasks.
- Finish - the planned date of task completion.
- Finish variance - an indicator of how far the planned completion date deviated from the one approved by the management.

S-curve of projects
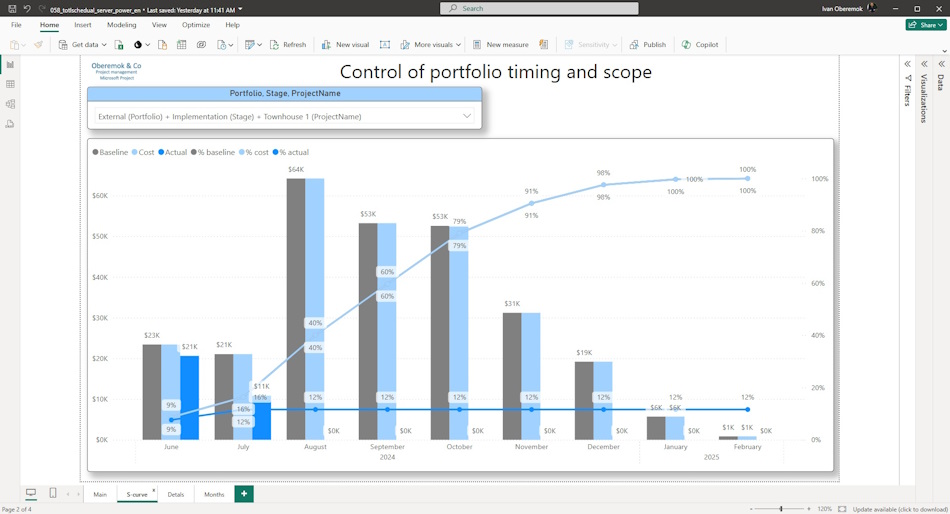
The graph shows an S-curve based on volumes. If you want to use this tool, you should add the “Volume” resource and specify its value for each task. The curves are presented on the chart.
- Baseline - the project cost approved by the management by periods.
- Cost - current planned project volume by periods.
- Actual - the currently utilized project scope.
- % baseline - approved percentage of completion by period.
- % cost - planned percentage of fulfillment by periods.
- % actual - actual percentage of fulfillment by periods.
Project results and current project tasks
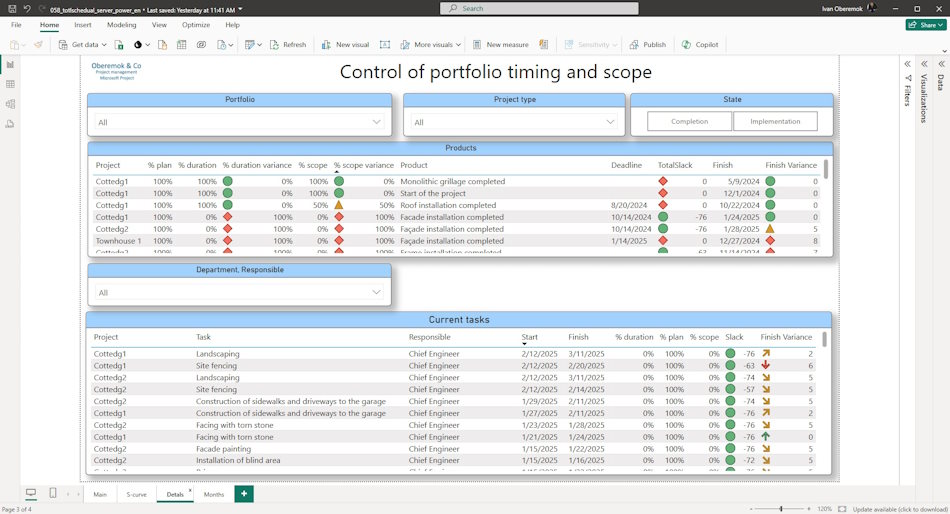
The Products section submits the entire list of project deliverables and their status. The results are described as milestones. The following items are given in this section:
- Project - project name.
- Product - name of the project product.
- % plan - the product's timeline readiness.
- % duration - the product readiness rate on the project schedule.
- % duration variance - the difference between the planned percentage and the readiness percentage in the project schedule. This field shows the quality of plan-schedule updates.
- % scope - product readiness according to the opinion of the Chief Engineer and the responsible specialties in the subject area.
- % scope variance - difference between planned percentage and percentage by spoce. This field shows the quality of the update of the project task scope.
- Deadline - date of the deadline for product delivery.
- Task slack - number of days of deviation from the deadline.
- Finish - planned date of product receipt.
- Finish variance - shows how far the planned date of product receipt deviated from the one approved by the management.
The “Current Tasks” section includes project tasks planned and not completed in the current time period. The list of tasks depends on the “% Completed” and “Status Report Date” fields. The following items are listed in this section:
- Project - project name.
- Task - the name of the tasks of the current time period.
- Responsible - name or role of the task responsible.
- Start - planned start date of the task.
- Finish - the planned date of task completion.
- % plan - planned percentage is calculated on the basis of the data on the actual start of task realization and the current date.
- % duration - percentage of project completion by time. The information is calculated on the basis of actual duration of tasks and start and end dates.
- % scope - percentage of project tasks accomplishment filled in by the Chief Engineer and responsible specialties in the subject area. The indicator shows the subjective assessment of responsible project specialists of the level of readiness of the project products.
- Task slack - number of days of deviation from the deadline.
- Finish variance - shows how far the planned completion date deviated from the one approved by the management.
Tasks for the current months
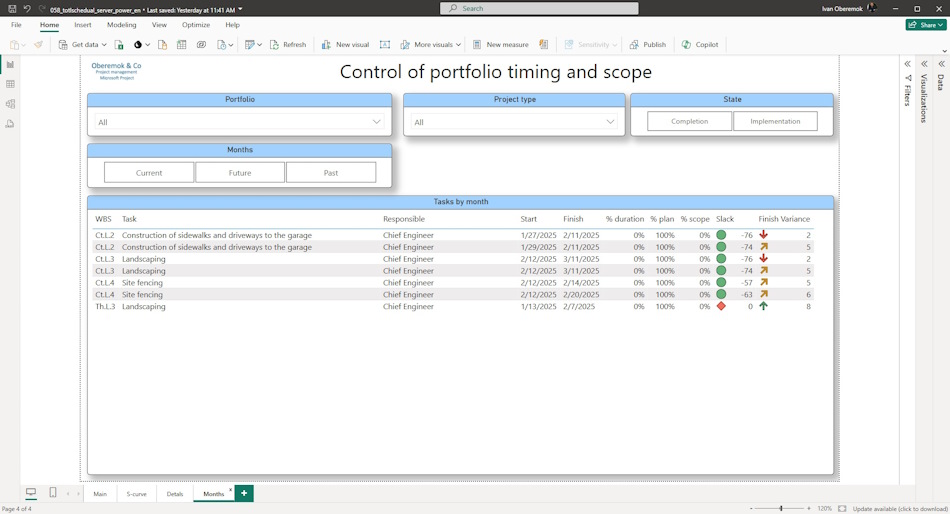
The “Months” page displays tasks of the past, current and future months. The list helps to evaluate the quality of project tasks realization. The list contains the following set of columns:
- Project - project name.
- WBS - value of the project work breakdown structure code for the top-level tasks.
- Task - task name.
- Responsible - name or role of those responsible for the tasks.
- Start - planned start date of the task.
- Finish - planned date of task completion.
- % plan - planned percentage is calculated based on the actual start date of the project and the current date.
- % duration - percentage of project completion by time. The information is calculated based on the actual duration of tasks and the start and end dates.
- % scope - percentage of project tasks completion completed by the Chief Engineer and responsible specialists in the subject area. The indicator shows the subjective assessment of responsible project specialists of the level of readiness of the project products.
- Task slack - number of days of deviation from the deadline.
- Finish variance - shows how far the planned completion date deviated from the one approved by the management.
Customize dashboard “Control portfolio timing and scope” in MS Power BI
How to get the dashboard “Control portfolio timing and scope” in MS Power BI
- Register or log in.
- Make a token payment.
- Download the file with the report.
How to customize the dashboard in MS Power BI
- Download MS Power BI and log in with your account.
- Open the report in MS Power BI.
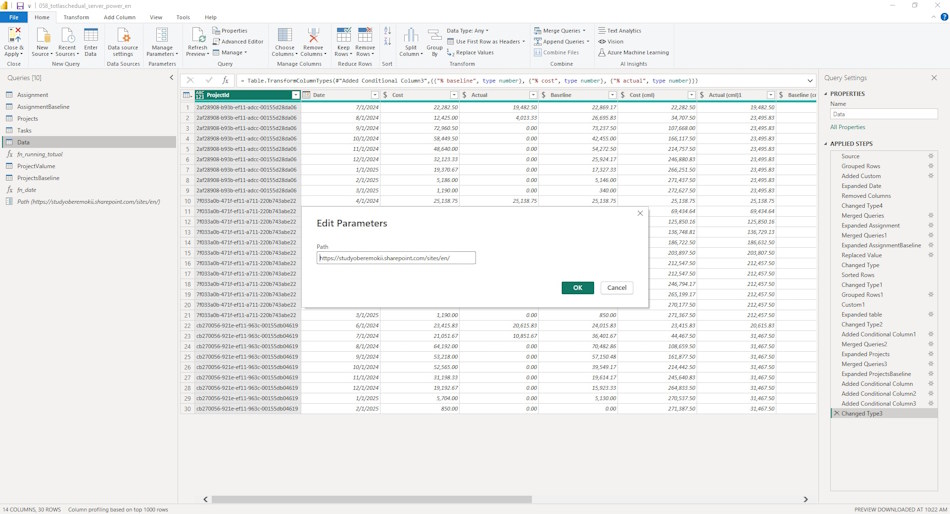
- Go to “Data” menu, “Get Data” item and “Run Power Query editor” sub-item.
- To do this, click on the “Path” parameter and replace the line “https://studyoberemokii.sharepoint.com/sites/en/” with your server address.
- Go to the “Home” menu item and the “Refresh Preview” sub-item.
- Specify portfolios and portfolio types in the “Projects” table and responsible groups in the “Tasks” table.
- In the same “Home” menu item, click the “Close and Apply” button.
Documents

Author: Ivan Oberemok
