
Cost analysis of contractors' work in the project portfolio dashboard in MS Excel
Contents:
- Cost analysis of contractors' work in the project portfolio in MS Excel
- Customize dashboard “Cost analysis of contractors' work costs of project portfolio” in MS Excel
- Chat
Cost analysis of contractors' work in the project portfolio in MS Excel
Based on the data of the register of certificates of completed works of the project portfolio and the register of payments to contractors, as well as the tasks of contractor projects, you can answer the following questions
- How well the payments to contractors are planned compared to the planned tasks.
- How well the plan of payments to contractors corresponds to actual payments and actually completed tasks in projects.
- To what extent the fact of payments to contractors corresponds to signed certificates of completed works and completed tasks of contractors in projects.
- The graph “Deviation of planned costs by periods” shows the difference between planned costs and planned payments by increasing total. The more the graph deviates from the zeros of the axis, the more problems with planning the costs of contractors' tasks.
The “Plan” page displays information about planned costs by time periods:
- Base costs - approved costs of project tasks assigned to contractors.
- Planned costs - planned costs of project tasks assigned to contractors.
- Plan payment - sum of planned payments under the contract.
- Base costs (cml) - base costs with increasing total.
- Plan costs (cml) - planned costs with increasing total.
- Payment plan (cml) - the sum of planned payments under the contract in cumulative total.
- Deviation on planned costs - the difference between planned costs and planned payments on an accruing total. According to this indicator you can evaluate the quality of the contract

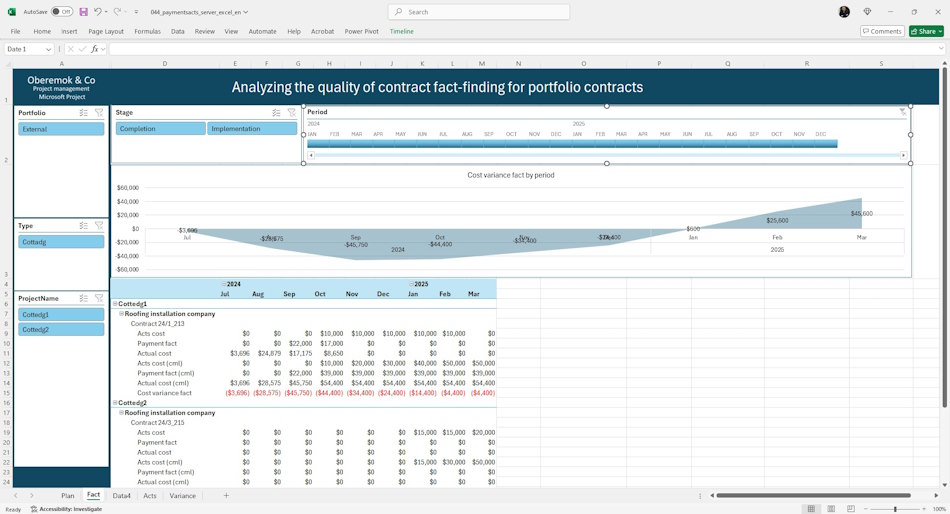
On the “Fact” page you can track the work with contractors of the portfolio projects.
The graph “Deviation by actual costs by period” shows the difference between actual costs and actual payments with increasing total. The more the graph departs from the zeros of the axis, the more problems with the actual costs of the contractors' tasks.
The “Fact” page displays information about planned costs by time periods:
- Actual costs - planned costs of project tasks assigned to contractors.
- Actual payment - amount of planned payments under the contract.
- Costs of acts - sum of costs according to acts of completed works.
- Actual costs (cml) - basic costs with increasing total.
- Actual payment (cml) - the sum of planned payments under the contract.
- Costs of acts (cml) - sum of costs under the acts of completed works on a growing total.
- Deviation on actual costs - the difference between actual costs and actual payments on an accruing total. By this indicator you can evaluate the quality of actual costs of contractors' tasks, certificates of completed works and actual payments.
Filters are shown on the page:
- Portfolio - groups of projects.
- Stage - filter by project stages.
- Project type - filter by project type.
- Project - filters by project name.
- Period - filter by time period.
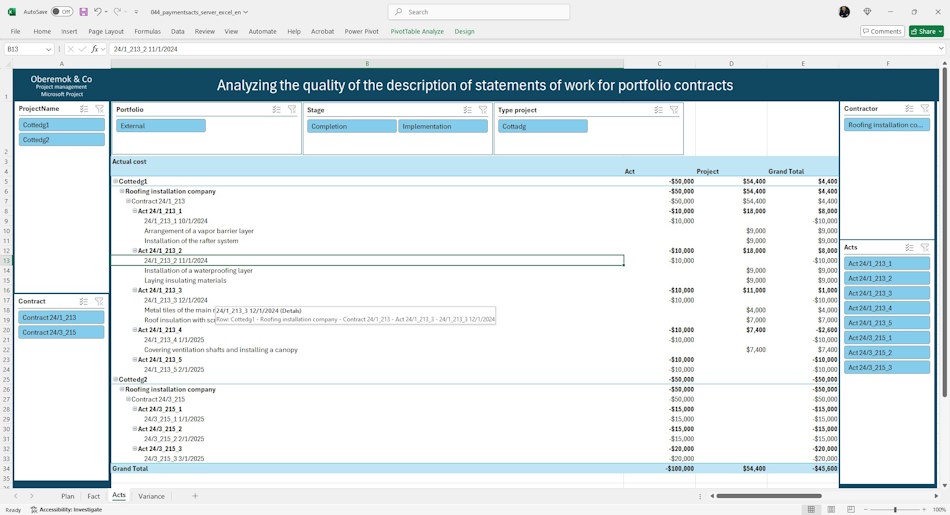
Effective evaluation of actual data is possible with quality planning and tracking of contractor tasks. On the “Acts” page you can compare the facts of project tasks and acts of task completion.
By comparing act costs and project costs you can find deviations in the data sources. Use the tables to control at the project, contractor and contract level.
The page shows filters:
- Portfolio - groups of projects.
- Stage - filter by project stages.
- Project Type - filter by project type.
- Project - filters by project name.
- Contractor - filters by contracting organizations.
- Contract - filter by contract names.
- Acts - filter by acts of completed works.
- Period - filter by time period.
By comparing the cumulative cost figures on the Deviation page, you can find problems with planning and tracking project contract costs.
The graph shows deviations for planned and actual project costs, as well as deviations for actual payments and costs by acts. For completed periods the deviation should be zero. For future periods the deviation should not be greater than the limit values.
The table displays information on costs on an accrual basis by time periods:
- Base costs (cml) - the sum of approved costs in projects on an accrual basis.
- Planned costs (cml) - sum of planned costs in projects cumulatively.
- Actual costs (cml) - the sum of actual costs in projects on an accrual basis.
- Plan payments (cml) - sum of planned payments under the contract on an accrual basis.
- Actual payments (cml) - the sum of actual payments under the contract on an accrual basis.
- Costs of the act (cml) - the sum of work performed under the contract on an accrual basis.
- Cost variants (project plan & actual) - the difference between the costs of planned payments and the costs of acts of work performed under the contract on an accrual basis. By this indicator you can evaluate the quality of planning of contract payments.
- Cost variants (payment & acts) - the difference between the cost of actual payments and the cost of certificates of completed works on an accrual basis. By this indicator you can assess the quality of contract security.
The page shows filters:
- Portfolio - groups of projects.
- Stage - filter by project stage.
- Project type - filter by project type.
- Project - filters by project name.
- Period - filter by time period.

Customize dashboard “Cost analysis of contractors' work costs of project portfolio” in MS Excel
- Register or log in.
- Make a payment.
- Download the file with the report.
How to customize the dashboard in MS Excel
- Download MS Excel and log in with your account.
- Open the report in MS Excel.
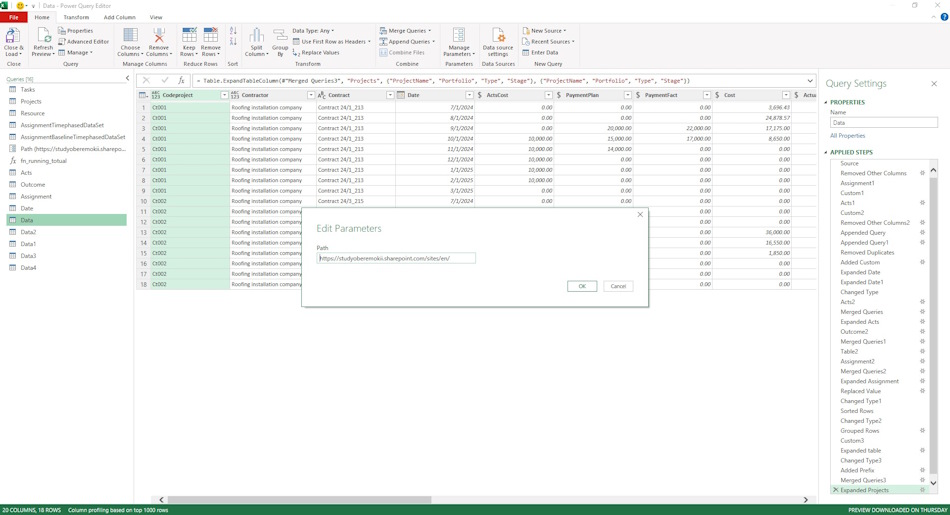
- Go to “Data” menu, “Get Data” item and sub-item “Launch Power Query Editor”.
- To do this, click on the “Path” parameter and replace the line “https://studyoberemokii.sharepoint.com/sites/en/” with your server address.
- Go to the “Home” menu item and the “Refresh Preview” sub-item.
- Refine the portfolios and portfolio types in the “Projects” table and the resource groups in the “Resources” table.
- In the same “Home” menu item, click the “Close & Load” button.
Documents

Author: Ivan Oberemok
