
Dashboard “Resource cost analysis of server projects” in MS Excel
Contents:
- Analyzing total resource costs of the server project portfolio in MS Excel
- Customizing the dashboard “Resource cost analysis of server project portfolio” in MS Excel
- Chat
Analyzing total resource costs of the server project portfolio in MS Excel
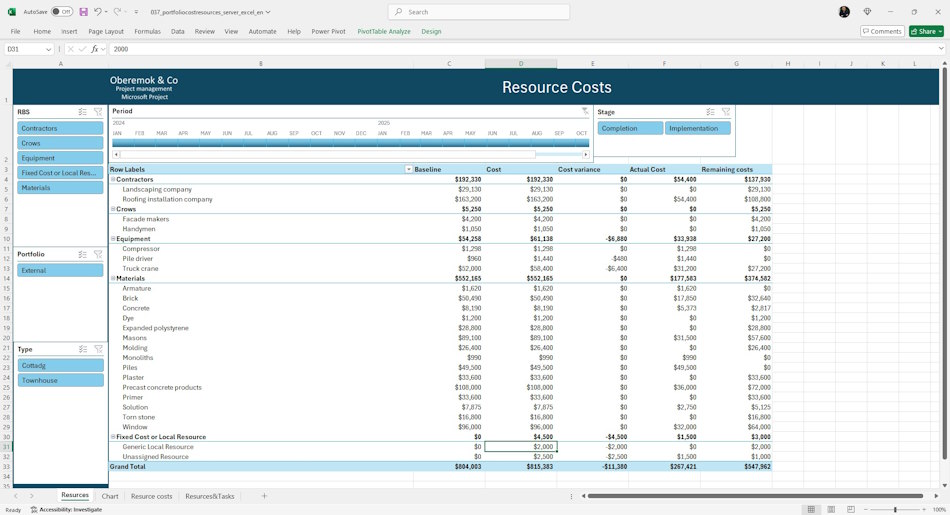
The “Resources” page of the MS Excel dashboard provides basic cost information. The list of project cost parameters includes:
- Base costs.
- Planned costs.
- Cost deviation (baseline vs. planned costs).
- Actual costs.
- Remaining costs.
The following filters are used on the page:
- RBS - resource groups.
- Portfolio - groups of projects.
- Stage - names of the stage the project is at.
- Period - the period of time for which resource costs are assigned.
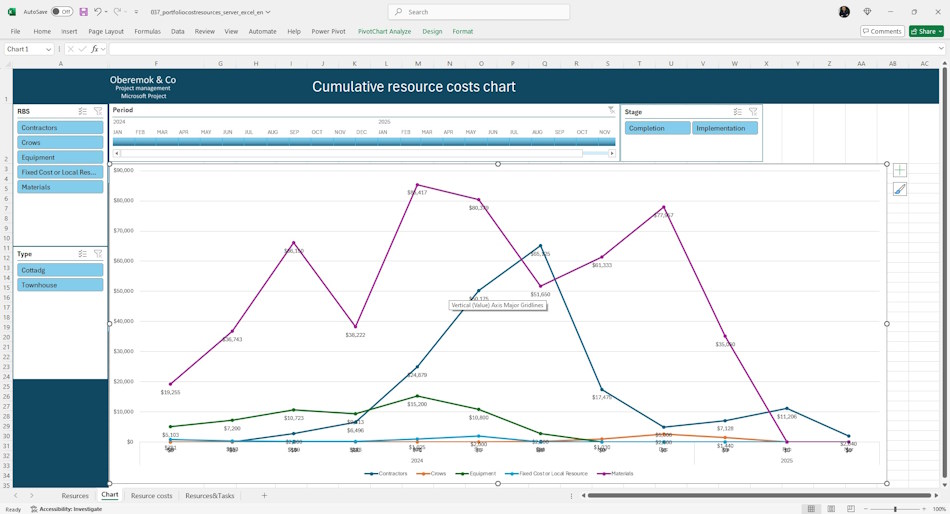
The “Chart” page shows a graph of planned costs of resource groups of the project portfolio.
The indicators are presented both for the entire portfolio and for individual projects. You can also select different time periods.
The following filters are used on the page:
- RBS - resource groups.
- Type - types of projects.
- Stage - names of the stage the project is at.
- Period - the period of time for which resource costs are assigned.
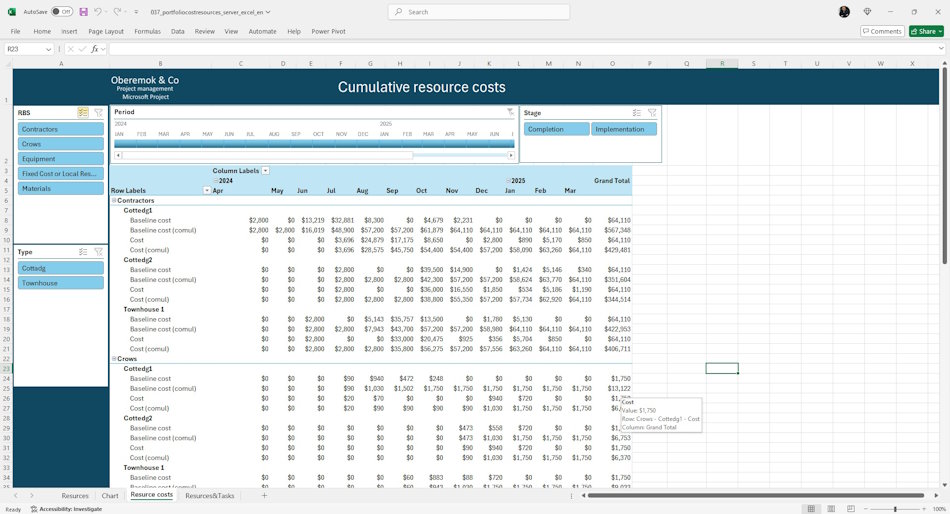
The “Resource costs” page presents the costs of the resource groups. The table shows the following cost figures for project resources:
- Base costs.
- Base costs in cumulative total.
- Resource Costs.
- Resource costs are cumulative.
The indicators are grouped by resource and project type and categorized by month and year.
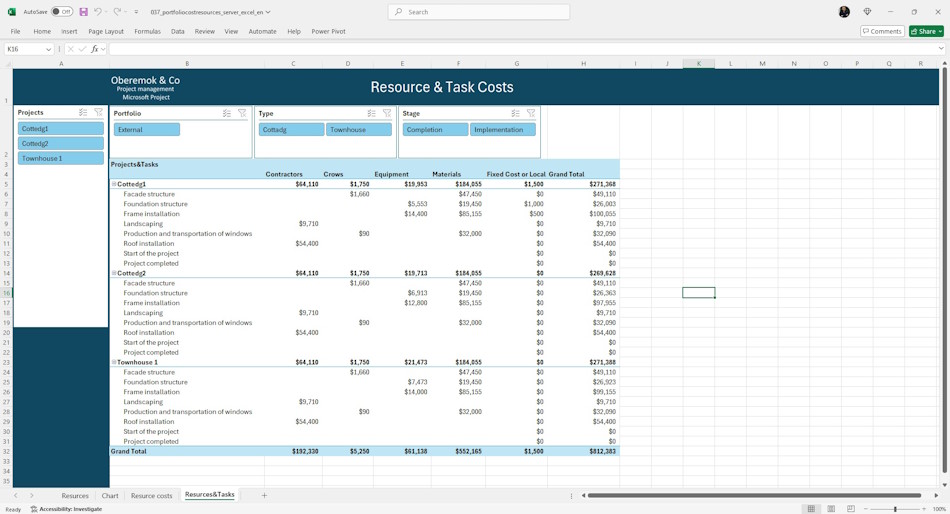
The “Resources and Tasks” tab shows the first level project tasks and the resource costs of these tasks.
The following filters are used on the page:
- Projects - list of portfolio projects.
- Portfolio - list of project portfolios.
- Type - types of projects.
- Stage - names of the stage the project is at.
Customizing the dashboard “Resource cost analysis of server project portfolio” in MS Excel
How to get the dashboard “Resource cost analysis of server project portfolio” in MS Excel
- Register or log in.
- Make a payment.
- Download the file with the report.
How to customize the dashboard in MS Excel
- Download MS Excel and log in with your account.
- Open the report in MS Excel.
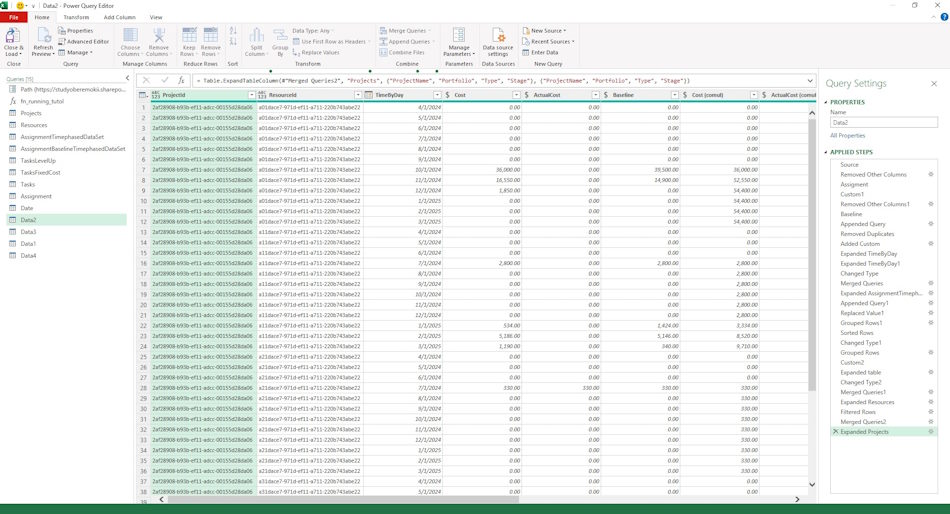
- Go to “Data” menu, “Get Data” item and sub-item “Launch Power Query Editor”.
- To do this, click on the “Path” parameter and replace the line “https://studyoberemokii.sharepoint.com/sites/en/” with your server address.
- Go to the “Home” menu item and the “Refresh Preview” sub-item.
- Refine the portfolios and portfolio types in the “Projects” table and the resource groups in the “Resources” table.
- In the same “Home” menu item, click the “Close & Load” button.

Author: Ivan Oberemok
