
Resource Costs report in MS Project Pro
Contents:
- Using the Resource Costs Report in MS Project Pro
- Set up the Resource Costs report in MS Project Pro
- Chat
Using the Resource Costs Report in MS Project Pro

The project cost table shows the total values of resource costs:
- Baseline costs.
- Planned costs.
- Cost variance.
- Actual costs.
- Remaining costs.
The "Resource Costs" chart shows the change in cost values by periods. The chart shows costs by resource groups.
The "Costs" chart shows the share of resource group costs.
You can use the "Cost Variances" chart to monitor resource variances.
Set up the Resource Costs report in MS Project Pro
How to get the Resource Costs report in MS Project Pro
- Register or log in to the site.
- Make a symbolic payment.
- Download the schedule with the report.
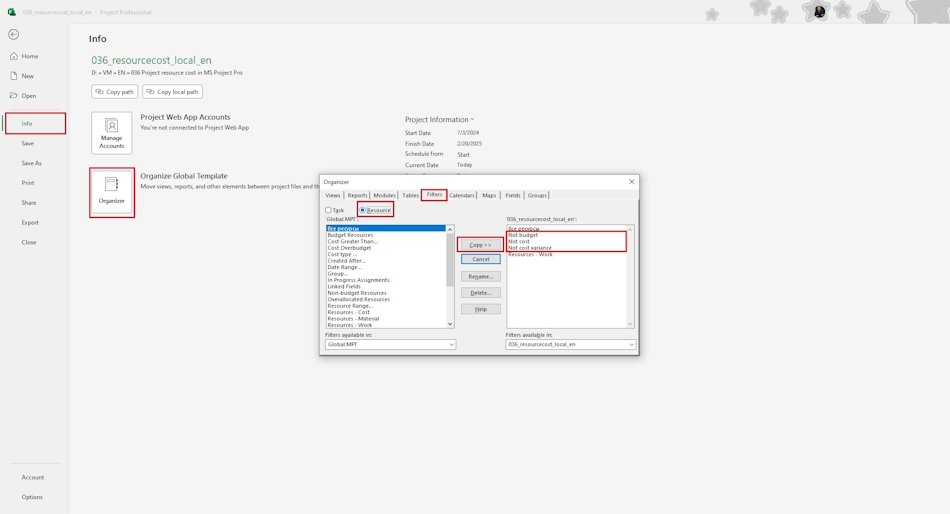
Steps for setting up the Resource Costs report in MS Project Pro
- Open the schedule with the report.
- Go to the Organizer section
- Copy the filters "Not budget", "Not costs" and "Not cost variances".
- Copy the Resource Costs report to your project or the "Global.mpt" project
- Open the report and check the report.
#projectmanagment, #projectcostmanagement, #planningprocess, #monitoringandcontrollingprocess, #msprojectpro, #msexcel, #oberemokii, #documents
Documents
Documant title: Resource Costs report in MS Project Pro
Price: € 10 / 520 UAH
Description: The "Resource Costs" report in MS Project Pro is used by the project team to analyze the project resource costs. When generating the report, information on the base, planned and actual costs of the project resources is used. Using the report, the project

Author: Ivan Oberemok
