
Analysis of portfolio cost and task cost on the server in MS Excel
Contents:
- Analysis of portfolio cost and task cost on the server in MS Excel
- Setting up the "Project task cost analysis on server" dashboard in MS Excel
- Chat
Analysis of portfolio cost and task cost on the server in MS Excel
The "Main" page of the MS Excel dashboard provides basic cost information. The list of project cost parameters includes:
- Budgets.
- Provision (difference between budgets and planned costs).
- Baseline costs.
- Planned costs.
- Cost variance (baseline from planned costs).
- Actual costs.
- Remaining costs.

The "Cumulative total" page shows a graph of project cost indicators in cumulative total. This graph is a particular implementation of the S-curve of project costs.
The "Project Costs in Cumulative Total" graph shows the following indicators in cumulative total:
- Budgets.
- Baseline costs.
- Planned costs.
- Actual costs.
The indicators are presented for the entire portfolio and for individual projects. You can also highlight different time periods.
With the graph data, the project team clarifies the reason for deviations in the indicators.

The "Tasks cost" page displays the costs of the top-level tasks. The table shows the following cost indicators for the project tasks:
- Baseline Cost
- Planned Cost
- Cost Variance
- Actual Cost
- Remaining Cost.
Using the Cost Variance column, the project team can see the tasks that are diverging from the baseline plan and decide whether to reschedule.

Setting up the "Project task cost analysis on server" dashboard in MS Excel
How to get the the "Project task cost analysis on server" dashboard in MS Excel
- Register or log in to the site.
- Make a payment.
- Download the report file.
How to customize a dashboard in MS Excel
- Load MS Excel and log in with your account
- Open the report in MS excel
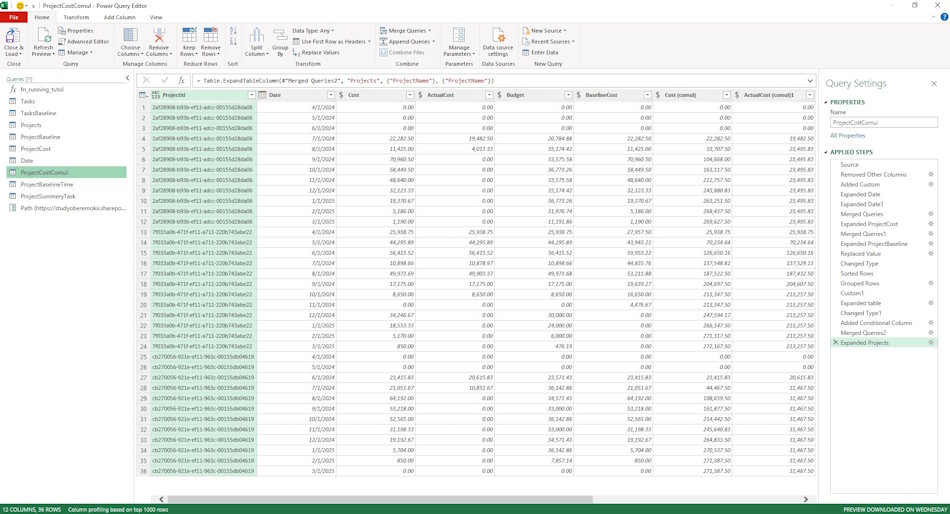
- Go to the “Data” menu, the “Get data” item and the “Launch Power Query editor” sub-item
- Change the server address for the table.
- To do this, click on the “Path” parameter and replace the line “https://studyoberemokii.sharepoint.com/sites/en/” with the address of your server.
- Go to the “Home” menu item and the “Update preview” sub-item.
- In the same “Home” item, click the “Close and Apply” button
Documents
- Send email: info@pmhub.pro
- Write to Telegram: +38 (097) 906-95-62. Send request
- Write on Whatsapp: +38 (097) 906-95-62. Send request
- Write on Viber: +38 (097) 906-95-62. Send request
- Call the phone: +38 (097) 906-95-62

Author: Ivan Oberemok
