
Analysis of funds receipt and budget of the portfolio in server in MS Power BI
Contents:
- Analysis of funds receipts and budgets of the portfolio in the server in MS Power BI
- Setting up the dashboard "Analysis of funds receipts and budgets of the portfolio in the server in MS Power BI"
- Chat
Analysis of funds receipts and budgets of the portfolio in the server in MS Power BI
Based on cash flow data and project portfolio budget plans, the total financing of the project portfolio is calculated. The calculation presents planned and actual information on the receipts and budgets of the project portfolio.
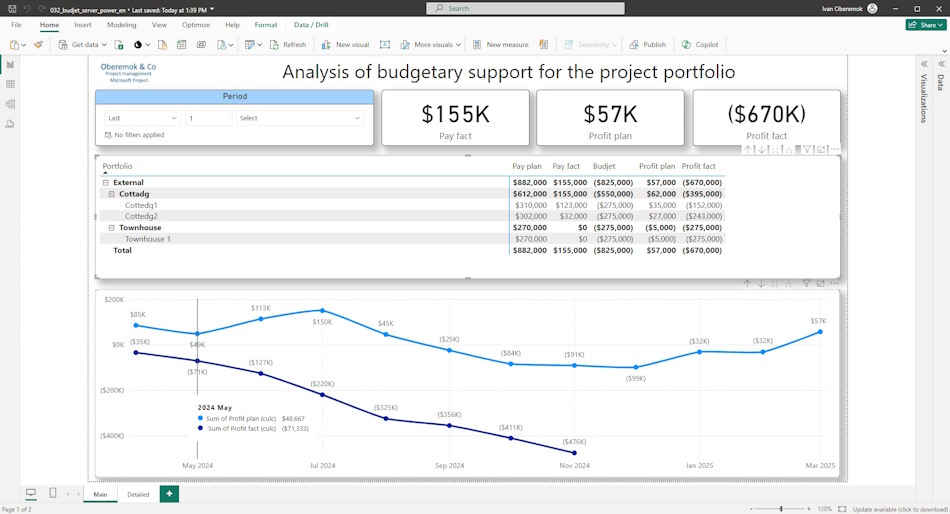
The purpose of the dashboard is to analyze and identify cash gaps, clarify cash receipts or re-plan project budgets.
The "Analysis" page presents a cash flow model grouped by projects. The table contains the following data:
- Cash receipt plan
- Cash receipt plan cumulative total
- Actual cash receipt
- Actual cash receipt cumulative total
- Project budget
- Project budget cumulative total
- Planned profit values. The values are calculated based on the difference between the values of the lines "Cash receipt plan cumulative total" and "Project budget cumulative total".
- Actual profit values. The values are calculated based on the difference between the values of the lines "Actual cash receipt cumulative total" and "Project budget cumulative total".
- The graph of the analysis of receipts and project budgets displays planned and actual profit values.
The chart is used to control deviations in cash flow cumulatively according to the plan and in fact, a separate chart is used. You can evaluate deviations for each project and for the entire portfolio.

Setting up the dashboard "Analysis of funds receipts and budgets of the portfolio in the server in MS Power BI"
How to get the dashboard "Analysis of funds receipts and budgets of the portfolio in the server in MS Power BI".
- Register or log in to the site.
- Make a nominal payment.
- Download the report file.
How to customize the dashboard in MS Excel
- Download MS Power BI from the link https://www.microsoft.com/en-us/download/details.aspx?id=58494.
- Install MS Power BI (consider the bitness of your operating system).
- Load MS Power BI and log in with your account.
- Open the report in MS Power BI.
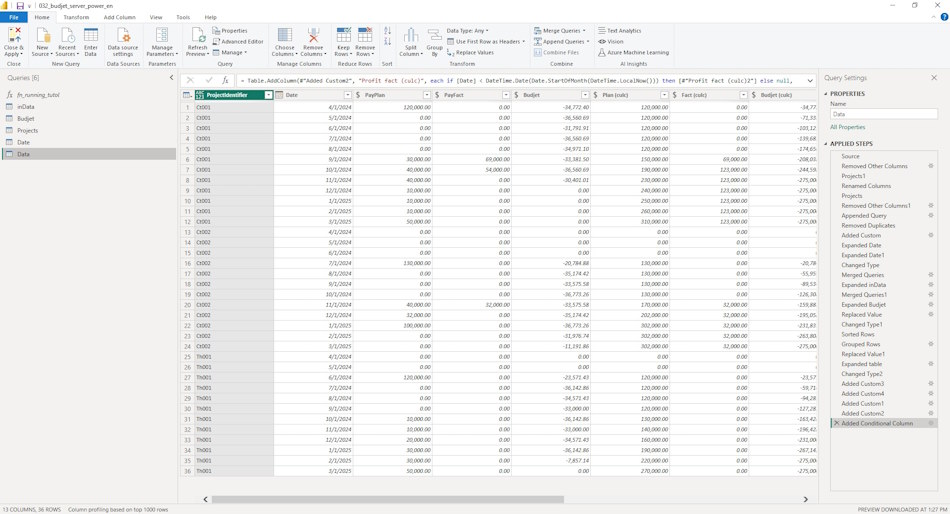
- Go to the “Home” menu item and the “Transform data” sub-item.
- Go through all the tables and change the server address.
- To do this, click on the “Source” item and replace the line “https://studyoberemokii.sharepoint.com/sites/en/” with the address of your server.
- Go to the “Home” menu item and the “Update all” sub-item.
- In the same “Home” item, click the “Close and Apply” button.
Documents

Author: Ivan Oberemok
