
Analysis of the portfolio cash flows in MS Excel
Contents:
- Analysis of portfolio cash flow from MS Project Server in MS Excel
- Setting up the "Portfolio cash flow from MS Project Server" dashboard in MS Excel
- Chat
Analysis of portfolio cash flow in MS Excel
Based on cash flow data, general information on portfolio costs is calculated. The calculation presents planned and actual information on portfolio receipts and costs. The profit and ROI of the project are calculated, as well as the deviation for each parameter.

Using information about payments to portfolio, we can conduct an analysis and identify cash gaps or inefficient use of funds in portfolio accounts.
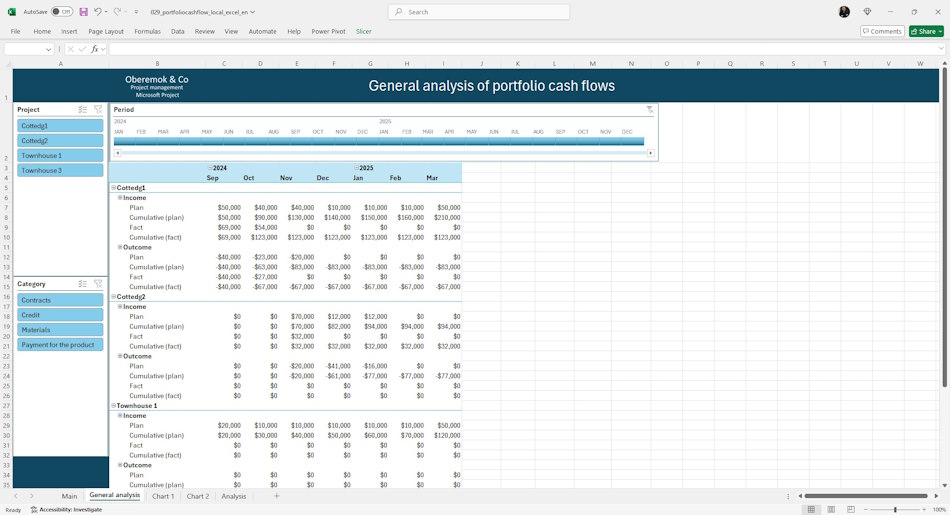
The Analysis page presents a cash flow model with grouping by items of both receipts and payments of the portfolio. The table presents the data:
- Cash receipt plan
- Cash receipt plan cumulative total
- Fact of cash receipt
- Fact of cash receipt cumulative total
- Payment plan
- Payment plan cumulative total
- Fact of payments
- Fact of payments cumulative total
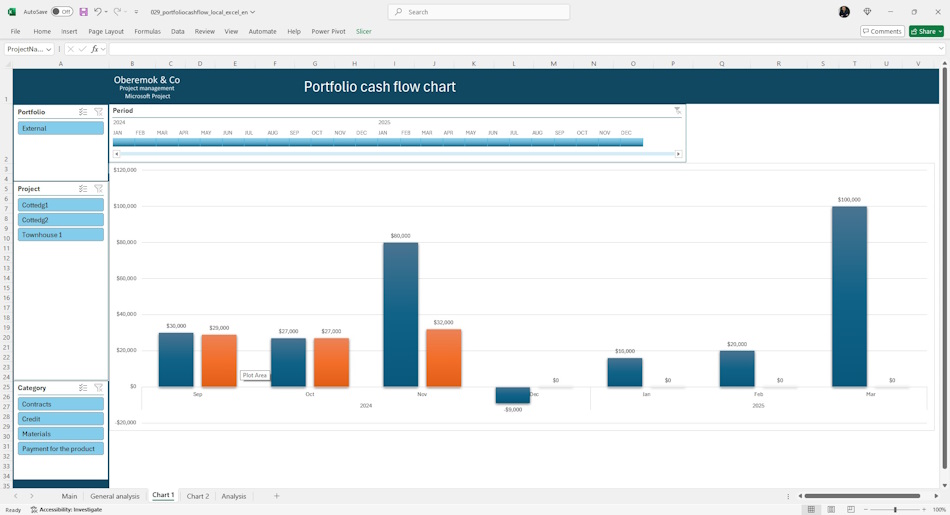
The cash flow chart shows the overall level of cash inflows and outflows in a portfolio.
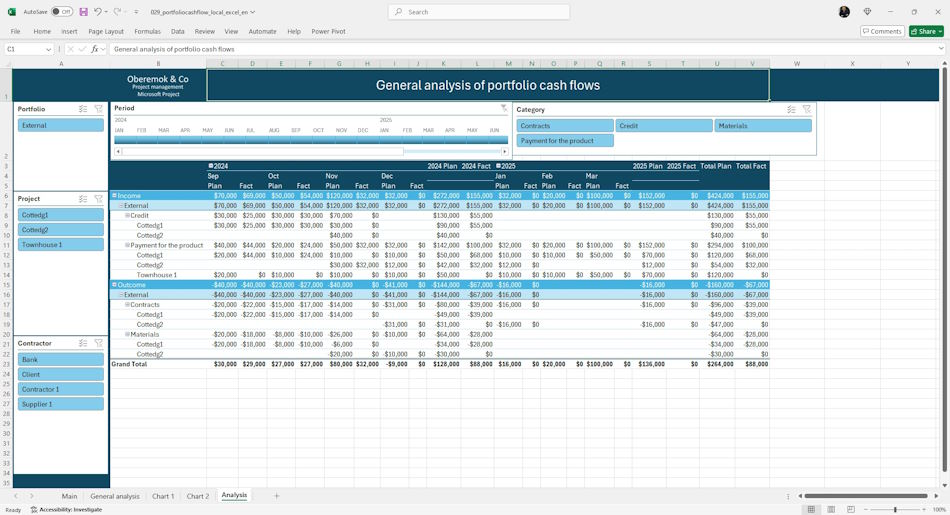
In a detailed analysis of the portfolio's funds, all planned and actual values of payments and expenses in the portfolio are displayed in one model.
This model shows not only the total amounts, but also the names of the counter parties, contracts, dates and descriptions of payments.

This model shows not only the cumulative total amounts, but also the names of the counter parties, contracts, dates and descriptions of payments.
Setting up the "Portfolio cash flow in MS Project Server" dashboard in MS Excel
How to get the dashboard in MS Excel
- Register or log in to the site.
- Make a nominal payment.
- Download the report file.
How to customize the dashboard in MS Excel
- Load MS Excel and log in with your account
- Open the report in MS excel
- Go to the “Data” menu, the “Get data” item and the “Launch Power Query editor” sub-item
- Change the server address for the table.
- To do this, click on the “Source” item and replace the line “https://studyoberemokii.sharepoint.com/sites/en/” with the address of your server.
- Go to the “Home” menu item and the “Update preview” sub-item.
- Go through all the steps and update the column names in the queries
- In the same “Home” item, click the “Close and Apply” button

Documents
- Send email: info@pmhub.pro
- Write to Telegram: +38 (097) 906-95-62. Send request
- Write on Whatsapp: +38 (097) 906-95-62. Send request
- Write on Viber: +38 (097) 906-95-62. Send request
- Call the phone: +38 (097) 906-95-62

Author: Ivan Oberemok
