
Analysis of the portfolio risk register in MS Power BI
Contents:
- Analysis of the server portfolio risk register in MS Power BI
- Setting up the "Analysis of the portfolio risk register in MS Power BI" dashboard in MS Power BI
- Chat
Analysis of the server portfolio risk register in MS Power BI
Several approaches can be used for practical implementation of calculating the priority of portfolio risks:
- Products of probability and impact (in points) of risks. The higher the obtained value, the higher the priority of the risks.
- Product of probability and impact in risk costs. The obtained value shows the company's losses when risks occur. Based on this value, a reserve for portfolio risks is formed.
Developing response methods - defining sequences of actions that allow using positive opportunities and countering threats.
The risk management plan includes two groups of activities:
- Mitigation plan. The activities described in this group are implemented from the project budget and should be immediately included in the project.
- Contingency plan. The activities described in this group are implemented from the project reserves. With clearly defined reserves of 15-20% of the projects budget, it is necessary to select the most significant risks. These activities are included in the plan in the event of a risk event. If the project team managed to prevent the risks, the funds for the implementation of this event go to the team's motivation fund.

The probability and impact matrix allows you to display portfolio risks by location on the graph. The greater the probability and impact of a risk on the portfolio the more attention should be paid to managing this risk.
The impact and probability matrix allows you to select the most priority risks. In the future, the project teams spends more time analyzing priority risks, which allows you to plan the team's time more effectively.
A more detailed description of risks allows for an assessment using the costs of minimizing negative consequences. The probability of risk occurrence is measured in percentages, and the impact in the costs of implementing measures to minimize negative consequences.
The use of this matrix at this stage allows for a more accurate determination of the risks that need to be addressed when implementing the portfolio.
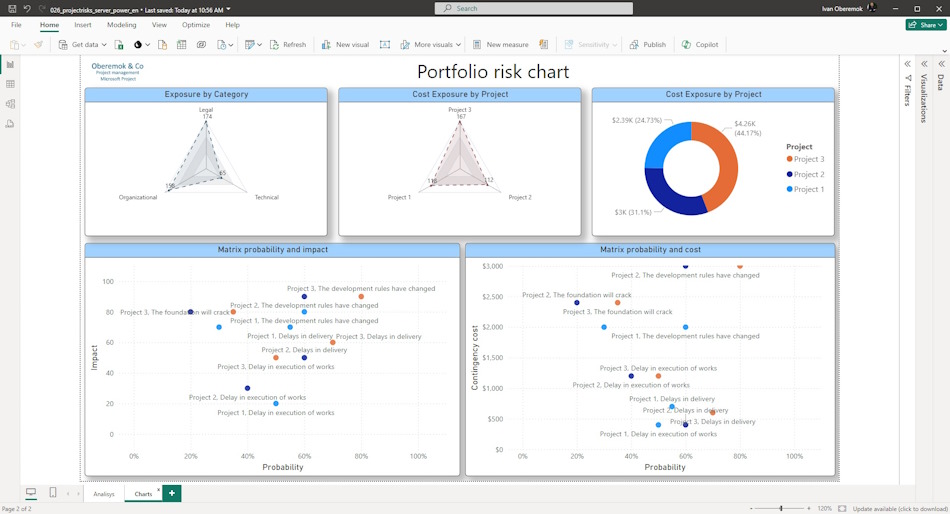
Setting up the "Analysis of the portfolio risk register" dashboard in MS Power BI
How to get the "Analysis of the portfolio risk register" dashboard in MS Power BI
- Register or log in to the site.
- Make a payment.
- Download the file with the document.
Load MS Power BIand log in with your account
- Download MS Power BI from the link https://www.microsoft.com/en-us/download/details.aspx?id=58494.
- Install MS Power BI (consider the bitness of your operating system).
- Load MS Power BI and log in with your account.
- Open the report in MS Power BI.
- Go to the “Home” menu item and the “Transform data” sub-item.
- Go through all the tables and change the server address.
- To do this, click on the “Source” item and replace the line “https://studyoberemokii.sharepoint.com/sites/en/” with the address of your server.
- Go to the “Home” menu item and the “Update all” sub-item.
- In the same “Home” item, click the “Close and Apply” button.

Documents

Author: Ivan Oberemok
