Connection between MS Project Server and MS Excel
Contents:
Setting up a Microsoft Excel connection to Microsoft Project Server data
Microsoft Project Server includes a dedicated reporting server that stores structured project information, which can be used for analytics, status tracking, and portfolio reporting. Connecting Microsoft Excel to this data source allows users to build tables, pivot tables, charts, and custom reports without manually exporting information from PWA. The overall process in Excel is very similar to creating a connection in Power BI - the only differences relate to interface layout and visualization options.
Steps to set up an MS Excel connection to MS Project Server data:
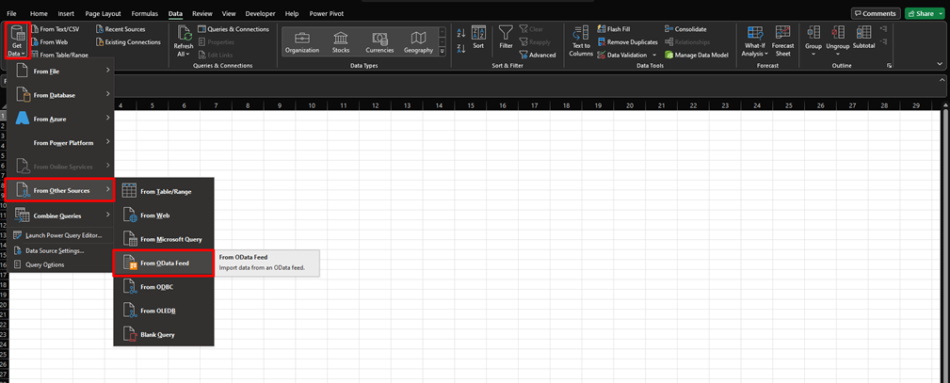
- Click the “Data” item in the top menu.
- Click the "Get Data " button in the "Get & Transform Data" block
- Click the "From Other Sources" item
- Click the "OData" subitem
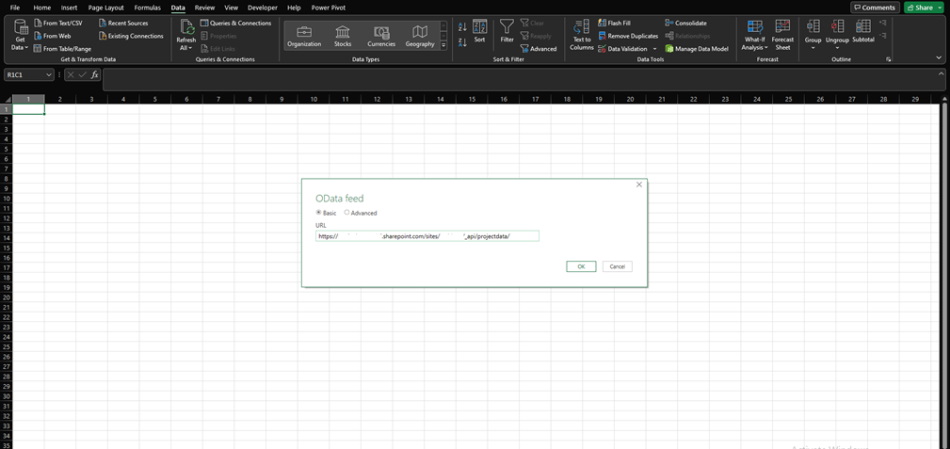
In the window that appears, Excel will prompt you to provide a link to the data source. For Project Server, the format of the OData address always ends with: "https://YOURSITENAME.sharepoint.com/sites/YOURPWANAME/_api/projectdata".
This link gives Excel access to the full set of reporting tables stored on the Project Server reporting database. After pasting the URL, click “OK”. Excel will authenticate the connection and display all available tables through the Navigator window.
Once the connection is established, the Navigator window appears. It contains a full tree of Project Server reporting tables—such as Projects, Tasks, Assignments, Resources, and various time‑phased datasets. Each table can be previewed on the right side of the window to ensure you are selecting the correct data.
You can choose one or multiple tables at the same time. After making your selection, you have two options:
- Load — imports the table directly into Excel.
- Transform Data — opens the Power Query Editor, where you can filter rows, remove columns, shape the dataset, or merge multiple tables before loading.

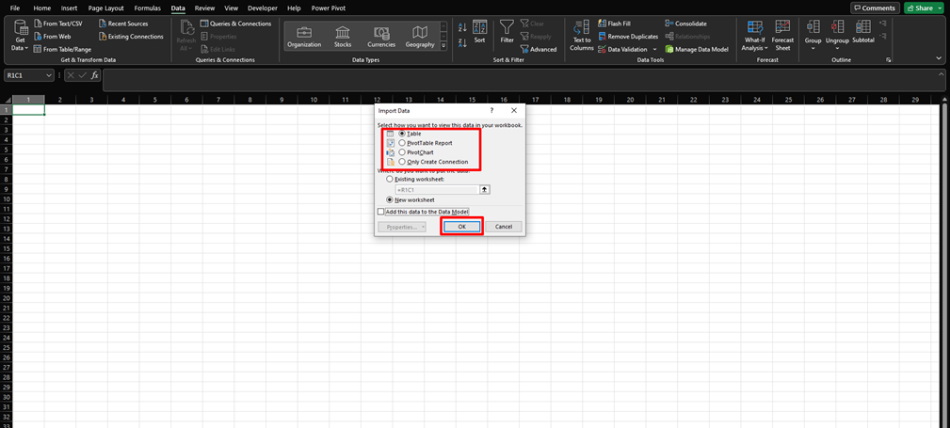
After selecting “Load”, Excel will ask how you want to insert the data into your workbook. You can load it as:
- Table — a standard Excel table placed directly on the worksheet.
- PivotTable Report — useful for summarizing large datasets.
- PivotChart — automatically creates a chart‑based visualization.
- Only Create Connection — stores the connection for later use without loading actual data into a sheet.
These options give flexibility depending on your reporting needs. For example, if you plan to build custom dashboards, loading data into pivot tables may be the most efficient choice. If you only need the connection for future queries, selecting “Only Create Connection” helps keep the workbook clean and lightweight.

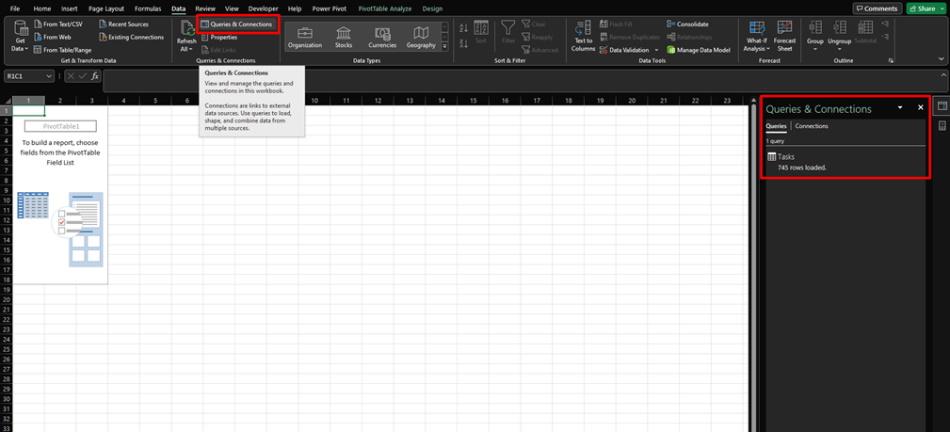
Once the data is loaded, Excel displays all active tables and data sources in the “Queries & Connections” pane, which can be opened from the Data tab. This panel allows you to refresh data, edit connection settings, rename queries, and track which tables are currently in use.
You can refresh any query manually or configure automatic updates. This ensures your reports always reflect the latest information from Project Server without recreating the connection.
Author: Ivan Oberemok
