
Plan % complete in MS Project Server
Contents:
- Creating the custom column "Plan % complete" in MS Project Onine
- Compare the "Plan % complete" column with the "% complete" column in MS Project Server
- Using graphical indicator for custom column "Remaining % complete" in MS Project Server
Creating the custom column "Plan % complete" in MS Project Onine
The project manager can update the project after the end of the implementation period. But in the during project implementation project, manager want to know, what percent complete must be for each tasks. We can calculate it using the current date.
Steps to create the custom column "Plan % complete" in MS Project Pro:
- Open MS Project Server
- Click the "Server Settings" item in the left menu.
- Click the "Enterprise Custom Fields and Lookup Tables" item in the "Enterprise Data" block.
- To create the custom fields, click the "New Field" button.
- Enter the "Plan % complete" in the "Name" field.
- Enter the field description in the "Description" field.
- Select the "Task" in the "Entity" field.
- Select the "Number" in the "Type" field.
- Select the Formula in the "Custom Attributes" block.
- Enter the formula: "IIf(NOW()<[Start],0,IIf(NOW()>[Finish],100,CLng(((NOW()-[Start])/([Finish]-[Start]))*100)))".
- Set the "Use formula" box in the "Calculation for Summary Rows" block.
- To save click the "Save" button.

Compare the "Plan % complete" column with the "% complete" column in MS Project Server
You can analyze the execution, compare the "Plan % Complete" column with the "% Complete" column.
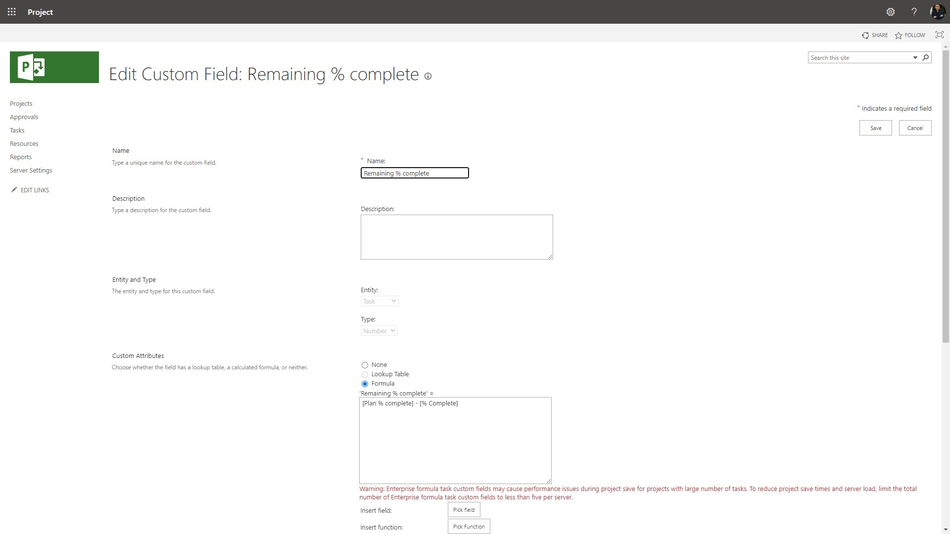
Steps to create the custom column "Remaining % complete" in MS Project Server:
- Open MS Project Server
- Click the "Server Settings" item in the left menu.
- Click the "Enterprise Custom Fields and Lookup Tables" item in the "Enterprise Data" block.
- To create the custom fields, click the "New Field" button.
- Enter the "Remaining % complete" in the "Name" field.
- Enter the field description in the "Description" field.
- Select the "Task" in the "Entity" field.
- Select the "Number" in the "Type" field.
- Select the Formula in the "Custom Attributes" block.
- Enter the formula: "[% Complete]-[Plan % complete]".
- Set the "Use formula" box in the "Calculation for Summary Rows" block.
- Set the "Graphical indicators" box in the "Values to Display" block.
- Enter the rules. (Read more "Adding a enterprise custom field with graphical indicators in MS Project Server")
- To save click the "Save" button.
Using graphical indicator for custom column "Remaining % complete" in MS Project Server
You can add graphical indicator to show the result of comparing the "Plan % complete" column with the "% complete" column
Steps to add custom columns: "Plan % Complete" and "Remaining % complete" in MS Project Server:
- Click the "Server Settings" item in the left menu.
- Click the "Manage Views" item in the "Look and Feel" block.
- Click the "Tasks Tracking" view.
- Add columns: "Plan % Complete" and "Remaining % complete" in the "Fields" block.
- To save click the "Save" button.
Steps to use custom columns: "Plan % Complete" and "Remaining % complete" in MS Project Server:
- Click the "Projects" item in the left menu.
- Select the project and click the project name.
- Click the "TASK" item in the top menu.
- Select the "Tasks Tracking" view in the "View" field in the "Data" block.
- Click the "Edit" button in the "Project" block and select the "In Browse" item.


Author: Ivan Oberemok
