
Connection from MS Power BI to data Project Server
Contents:
Setting up a MS Power BI connection to MS Project Server data
Microsoft Project Server includes a built‑in reporting server that allows users to access a wide variety of project‑related information. This data can be used to create analytical reports, dashboards, and performance summaries in Microsoft Power BI. Establishing a connection between Power BI and Project Server enables project managers, analysts, and PMO specialists to work with up‑to‑date project data directly in an interactive reporting environment.
Project Server has a reporting server which give users possibility to get different information for preparing analytical reports.
Steps to set up an MS Power BI connection to MS Project Server data:
- Login
- Click "Login" button.
- Enter your login in the "" field.
- Click "Ok" button.
- Click the “Home” item in the top menu.
- Click the "Data " button in the "Own" block
- Click the "Get data" item
- Click the "OData" subitem
To connect Power BI to Project Server, you need to provide the correct OData feed URL. This link points Power BI to the reporting endpoint of your PWA site.
The URL format must include your site address followed by: “_api/projectdata”.
For example, it must look like: https://YOURSITENAME.sharepoint.com/sites/YOURPWANAME/_api/projectdata.
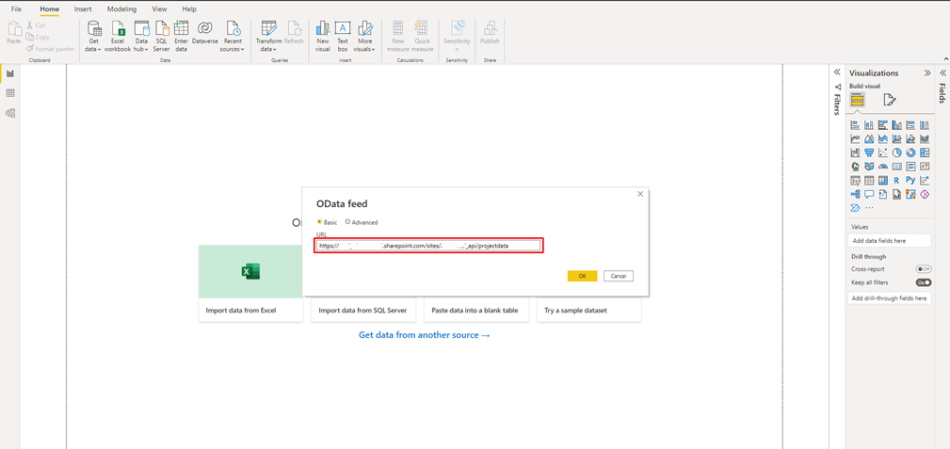
This endpoint exposes all Project Data reporting tables that Power BI can import. Once you paste the link into the OData feed window, Power BI will attempt to establish a secure connection and retrieve the list of available tables.
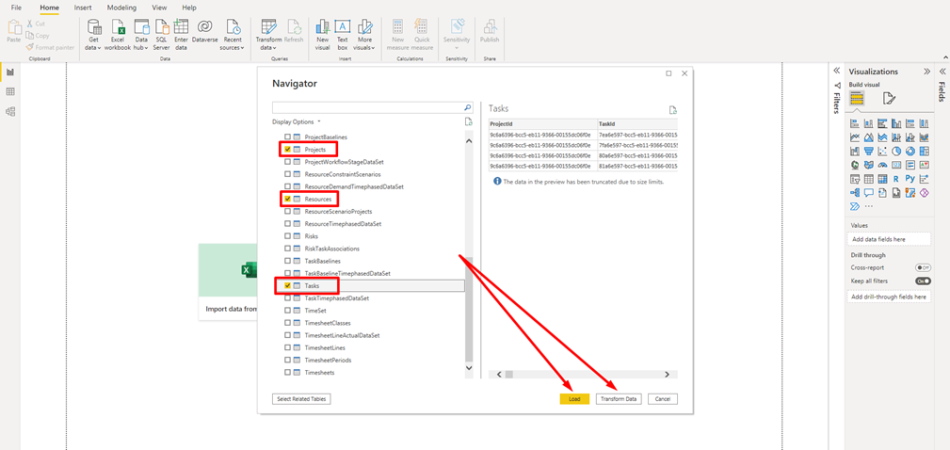
After the connection is created, Power BI will display the Navigator window. Here you will see a full list of reporting tables available in Project Data. These may include Projects, Tasks, Assignments, Resources, and many others. Each table contains a specific category of project‑related information and can be loaded individually or together, depending on the reporting needs.
From this list, you can choose one or several tables. You may preview the structure and content of each table before loading it. Power BI offers two options:
- Load — instantly imports the selected tables into the Power BI data model.
- Transform Data — opens the Power Query Editor, allowing you to clean, filter, and transform the data before loading it.
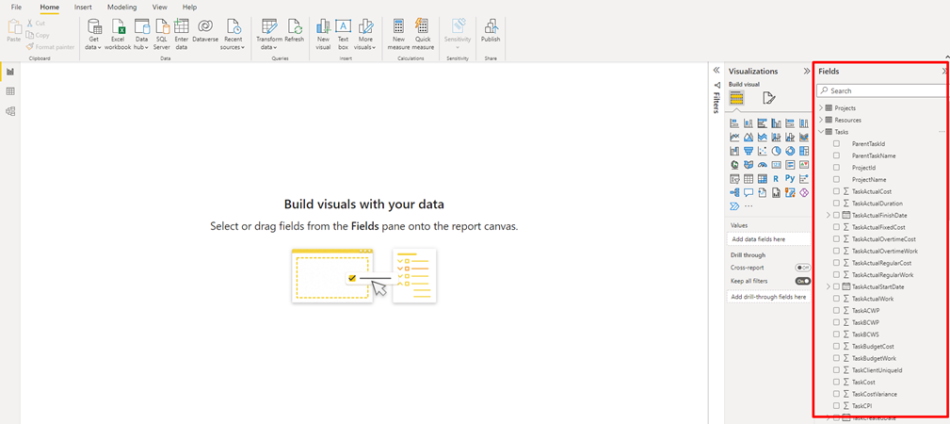
Once the data is successfully imported, all tables become visible in the “Fields” pane on the right side of the Power BI interface. Each table can be expanded to view individual columns — such as task names, start and finish dates, resource assignments, project identifiers, and more.
From here, you can start building visuals by dragging fields onto the report canvas. Power BI allows creating charts, timelines, matrices, KPI cards, and other visuals that help project managers analyze performance, identify bottlenecks, and monitor progress across the entire project portfolio.
Connecting MS Project Server to Power BI significantly enhances reporting capabilities. Instead of manually exporting data, users can rely on automated refresh schedules, interactive dashboards, and consolidated project insights. This integration helps teams make more informed decisions and maintain transparency across all levels of project management.

Author: Ivan Oberemok
